PNY Pro Elite V2 and Elite-X PRO Portable SSDs Review: Performance on a Budget
by Ganesh T S on June 30, 2023 8:00 AM ESTPerformance Benchmarks - PNY Pro Elite V2 1 TB
Benchmarks such as ATTO and CrystalDiskMark help provide a quick look at the performance of the direct-attached storage device. The results translate to the instantaneous performance numbers that consumers can expect for specific workloads, but do not account for changes in behavior when the unit is subject to long-term conditioning and/or thermal throttling. Yet another use of these synthetic benchmarks is the ability to gather information regarding support for specific storage device features that affect performance.
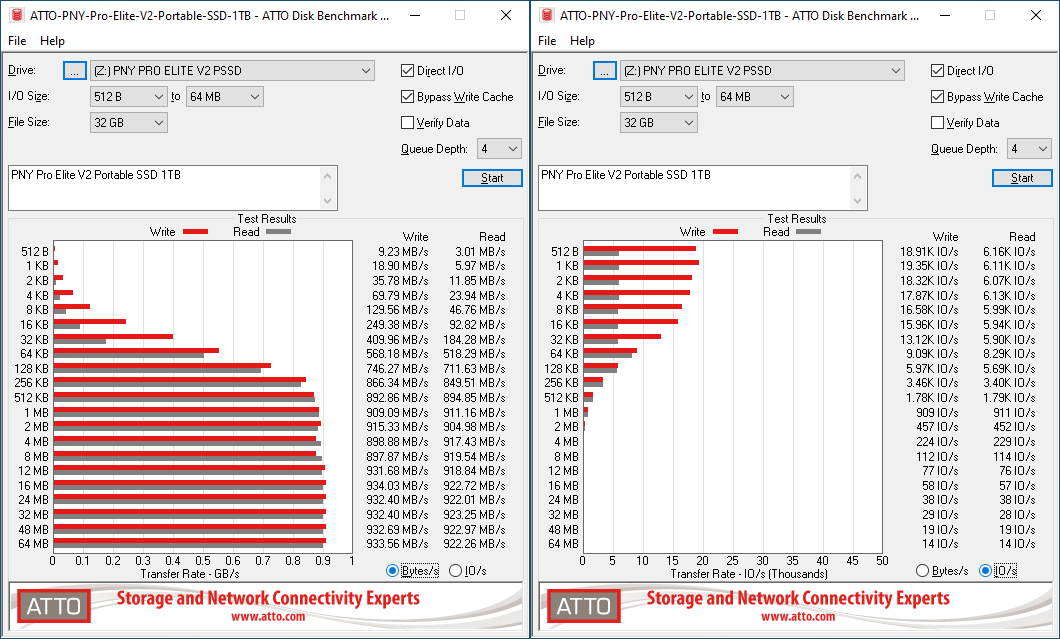
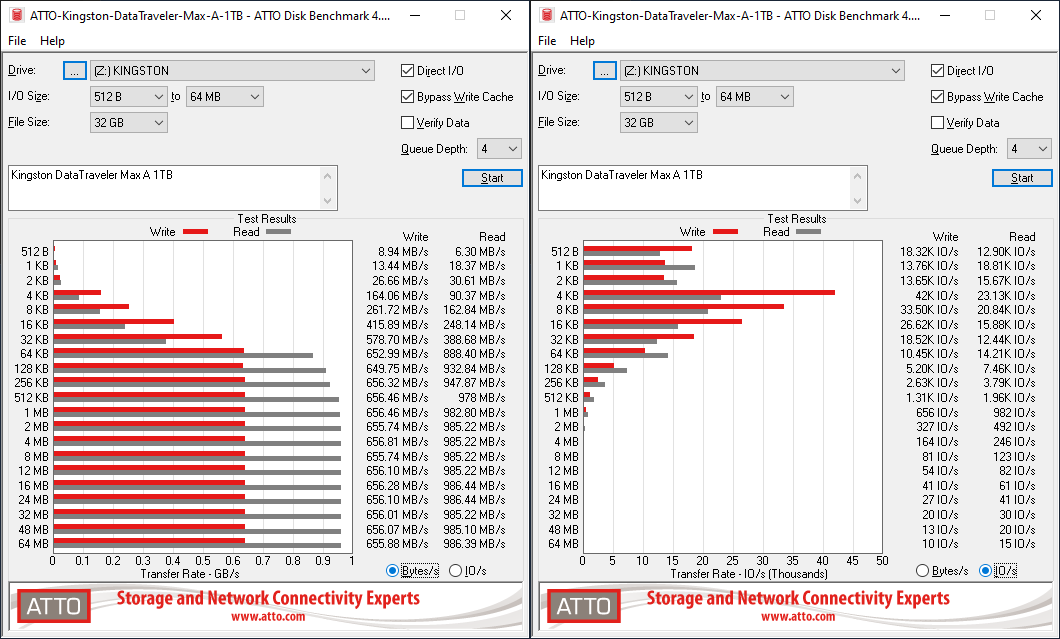
PNY claims read and write speeds of 1100 MBps and 1000 MBps respectively, and numbers close to this are hit in our ATTO benchmark configuration. ATTO benchmarking is restricted to a single configuration in terms of queue depth, and is only representative of a small sub-set of real-world workloads. It does allow the visualization of change in transfer rates as the I/O size changes, with optimal performance being reached around 16 MB for a queue depth of 4.
| ATTO Benchmarks | |
| TOP: | BOTTOM: |
 |
|
 |
|
The performance of the Pro Elite V2 in the ATTO benchmark is very similar to that of the OWC Envoy Pro Mini. The performance profile is better than the Transcend ESD310C and the Kingston DT Max series, but loses out to bridge-based solutions like the Samsung T7 Touch and the OWC Envoy Pro Elektron.
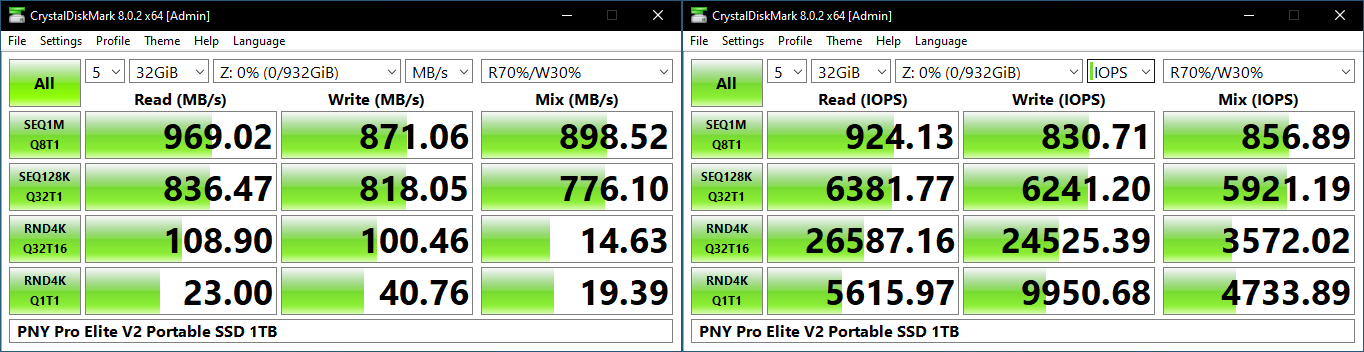
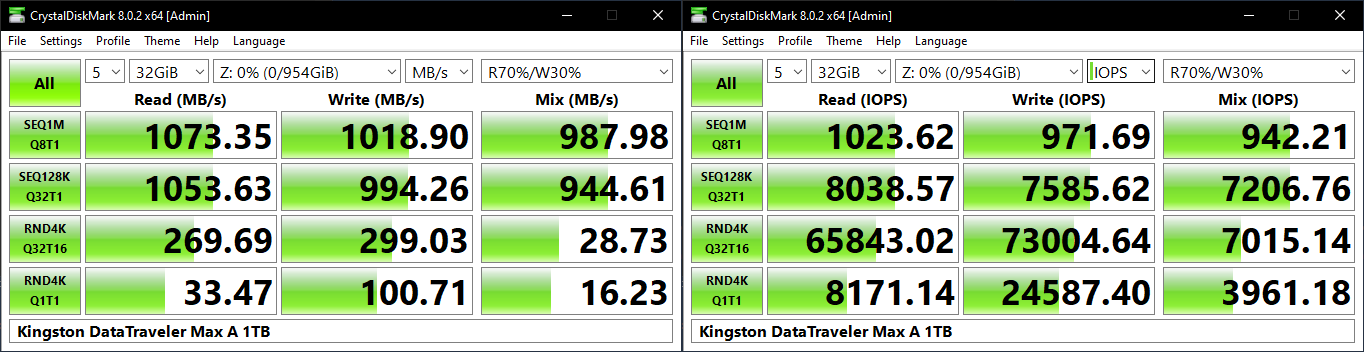
CrystalDiskMark uses four different access traces for reads and writes over a configurable region size. Two of the traces are sequential accesses, while two are 4K random accesses. Internally, CrystalDiskMark uses the Microsoft DiskSpd storage testing tool. The 'Seq128K Q32T1' sequential traces use 128K block size with a queue depth of 32 from a single thread, while the '4K Q32T16' one does random 4K accesses with the same queue configuration, but from multiple threads. The 'Seq1M' traces use a 1MiB block size. The plain 'Rnd4K' one uses only a single queue and single thread . Comparing the '4K Q32T16' and '4K Q1T1' numbers can quickly tell us whether the storage device supports NCQ (native command queuing) / UASP (USB-attached SCSI protocol). If the numbers for the two access traces are in the same ballpark, NCQ / UASP is not supported. This assumes that the host port / drivers on the PC support UASP.
| CrystalDiskMark Benchmarks | |
| TOP: | BOTTOM: |
 |
|
 |
|
Variations in queue depth bring out the performance potential of the SM2320-based PSSDs over the Phison solutions. Other than that, we see the Pro Elite V2 and the OWC Envy Pro Mini perform very similar to each other. The numbers for the bridge-based solutions are obviously better.
AnandTech DAS Suite - Benchmarking for Performance Consistency
Our testing methodology for storage bridges / direct-attached storage units takes into consideration the usual use-case for such devices. The most common usage scenario is transfer of large amounts of photos and videos to and from the unit. Other usage scenarios include the use of the unit as a download or install location for games and importing files directly from it into a multimedia editing program such as Adobe Photoshop. Some users may even opt to boot an OS off an external storage device.
The AnandTech DAS Suite tackles the first use-case. The evaluation involves processing five different workloads:
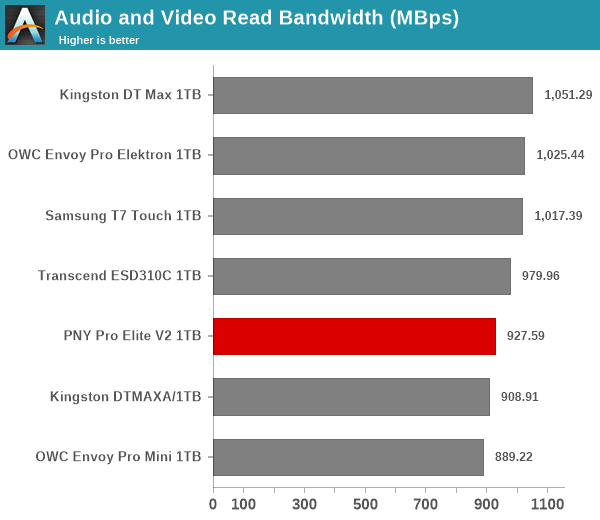
- AV: Multimedia content with audio and video files totalling 24.03 GB over 1263 files in 109 sub-folders
- Home: Photos and document files totalling 18.86 GB over 7627 files in 382 sub-folders
- BR: Blu-ray folder structure totalling 23.09 GB over 111 files in 10 sub-folders
- ISOs: OS installation files (ISOs) totalling 28.61 GB over 4 files in one folder
- Disk-to-Disk: Addition of 223.32 GB spread over 171 files in 29 sub-folders to the above four workloads (total of 317.91 GB over 9176 files in 535 sub-folders)
Except for the 'Disk-to-Disk' workload, each data set is first placed in a 29GB RAM drive, and a robocopy command is issue to transfer it to the external storage unit (formatted in exFAT for flash-based units, and NTFS for HDD-based units).
robocopy /NP /MIR /NFL /J /NDL /MT:32 $SRC_PATH $DEST_PATH
Upon completion of the transfer (write test), the contents from the unit are read back into the RAM drive (read test) after a 10 second idling interval. This process is repeated three times for each workload. Read and write speeds, as well as the time taken to complete each pass are recorded. Whenever possible, the temperature of the external storage device is recorded during the idling intervals. Bandwidth for each data set is computed as the average of all three passes.
The 'Disk-to-Disk' workload involves a similar process, but with one iteration only. The data is copied to the external unit from the CPU-attached NVMe drive, and then copied back to the internal drive. It does include more amount of continuous data transfer in a single direction, as data that doesn't fit in the RAM drive is also part of the workload set.
All the considered PSSDs start out with similar numbers for the initial benchmark components. However, as the stress keeps getting sustained, we see the bridge-based solutions emerging as the top performers (evident in the disk-to-disk numbers). For all practical purposes, the casual user will notice no difference between them in the course of normal usage which involve short bursts of writes. However, power users may want to dig deeper to understand the limits of each device. To address this concern, we also instrumented our evaluation scheme for determining performance consistency.
Performance Consistency
Aspects influencing the performance consistency include SLC caching and thermal throttling / firmware caps on access rates to avoid overheating. This is important for power users, as the last thing that they want to see when copying over 100s of GB of data is the transfer rate going down to USB 2.0 speeds.
In addition to tracking the instantaneous read and write speeds of the DAS when processing the AnandTech DAS Suite, the temperature of the drive was also recorded. In earlier reviews, we used to track the temperature all through. However, we have observed that SMART read-outs for the temperature in NVMe SSDs using USB 3.2 Gen 2 bridge chips end up negatively affecting the actual transfer rates. To avoid this problem, we have restricted ourselves to recording the temperature only during the idling intervals. The graphs below present the recorded data.
| AnandTech DAS Suite - Performance Consistency | |
| TOP: | BOTTOM: |
 |
|
 |
|
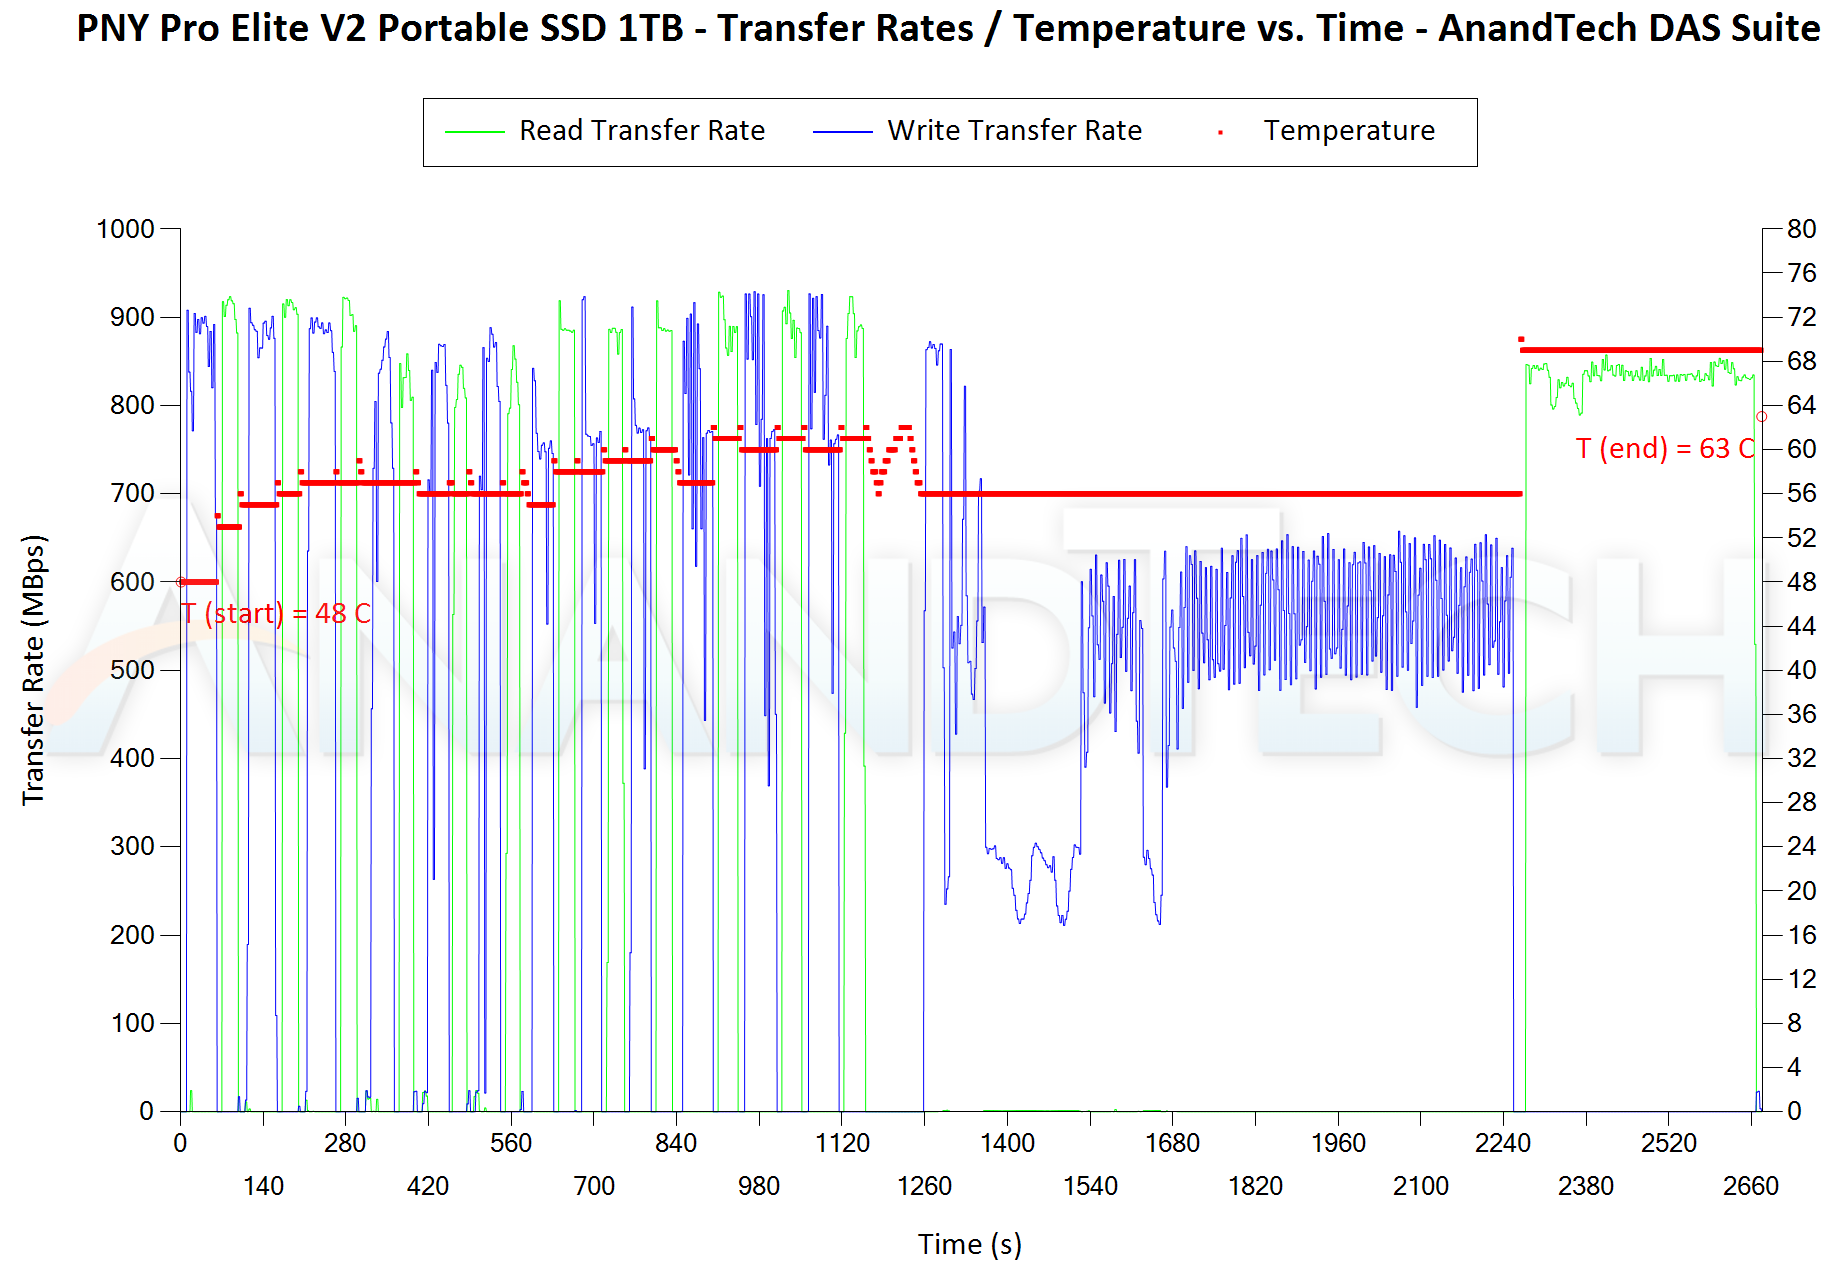
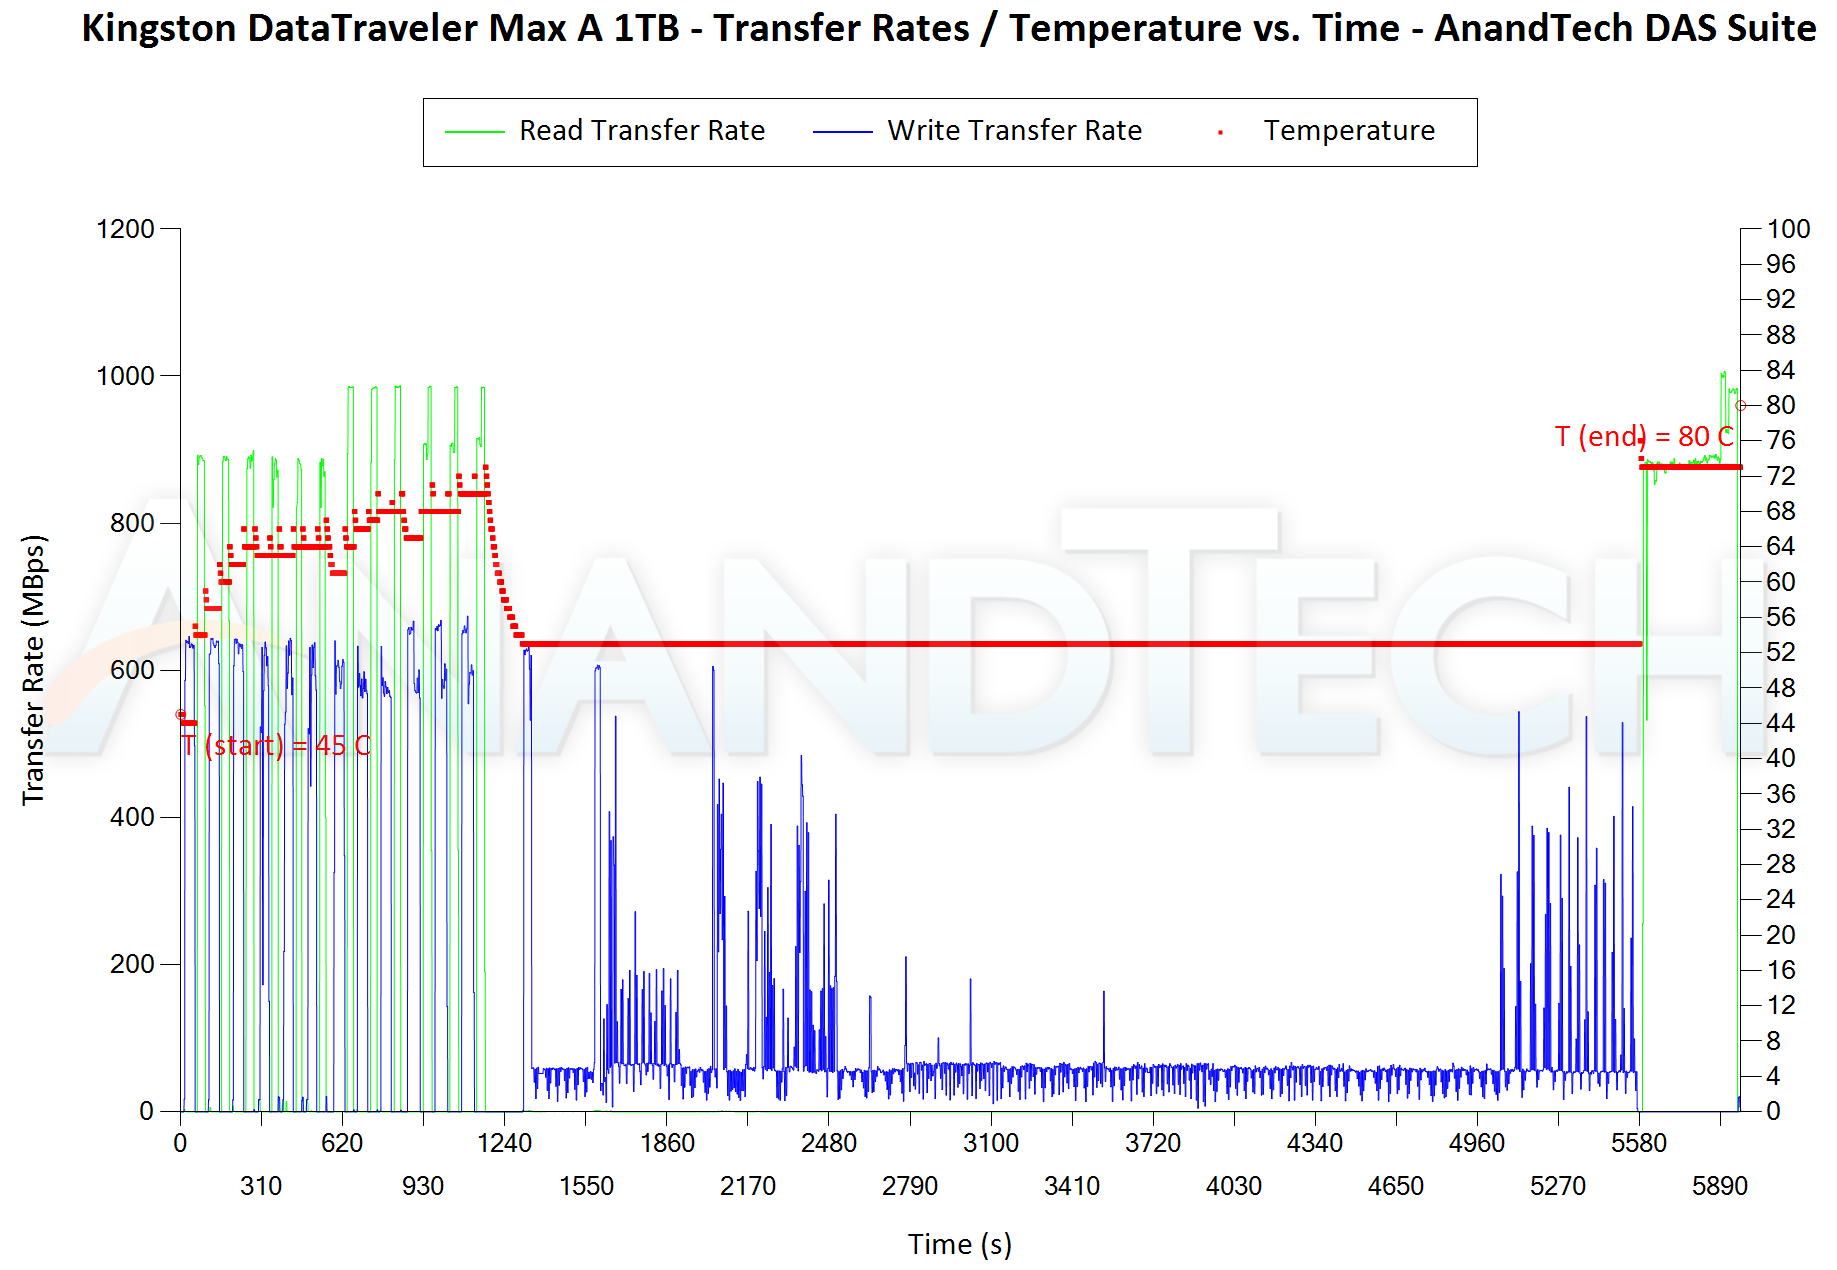
The first three sets of writes and reads correspond to the AV suite. A small gap (for the transfer of the video suite from the internal SSD to the RAM drive) is followed by three sets for the Home suite. Another small RAM-drive transfer gap is followed by three sets for the Blu-ray folder. This is followed up with the large-sized ISO files set. Finally, we have the single disk-to-disk transfer set. The most interesting comparison (based on the results in the previous subsections) is between the PNY Pro Elite V2 and the OWC Envoy Pro Mini - we see that the OWC thumb drive gets thermally throttled after hitting 60C, but still got hot enough to hit 78C. The larger size of the PNY Pro Elite V2 and the spread out PCB components ensure that the same workload is managed successfully to keep the temperatures below 70C. Some SLC caching issues are seen in the disk-to-disk transfer set, but post-partial recovery numbers appears quite reasonable. Writes at 500 MBps and reads at 800 MBps towards the end are quite good for a native UFD controller solution. Only the bridge-based solutions are better in that aspect. The Pro Elite V2 also seems to guarantee a minimum write speed of around 200 MBps - very similar to that of the OWC Envoy Pro Mini in its thermally throttle state.
PCMark 10 Storage Bench - Real-World Access Traces
There are a number of storage benchmarks that can subject a device to artificial access traces by varying the mix of reads and writes, the access block sizes, and the queue depth / number of outstanding data requests. We saw results from two popular ones - ATTO, and CrystalDiskMark - in a previous section. More serious benchmarks, however, actually replicate access traces from real-world workloads to determine the suitability of a particular device for a particular workload. Real-world access traces may be used for simulating the behavior of computing activities that are limited by storage performance. Examples include booting an operating system or loading a particular game from the disk.
PCMark 10's storage bench (introduced in v2.1.2153) includes four storage benchmarks that use relevant real-world traces from popular applications and common tasks to fully test the performance of the latest modern drives:
- The Full System Drive Benchmark uses a wide-ranging set of real-world traces from popular applications and common tasks to fully test the performance of the fastest modern drives. It involves a total of 204 GB of write traffic.
- The Quick System Drive Benchmark is a shorter test with a smaller set of less demanding real-world traces. It subjects the device to 23 GB of writes.
- The Data Drive Benchmark is designed to test drives that are used for storing files rather than applications. These typically include NAS drives, USB sticks, memory cards, and other external storage devices. The device is subjected to 15 GB of writes.
- The Drive Performance Consistency Test is a long-running and extremely demanding test with a heavy, continuous load for expert users. In-depth reporting shows how the performance of the drive varies under different conditions. This writes more than 23 TB of data to the drive.
Despite the data drive benchmark appearing most suitable for testing direct-attached storage, we opt to run the full system drive benchmark as part of our evaluation flow. Many of us use portable flash drives as boot drives and storage for Steam games. These types of use-cases are addressed only in the full system drive benchmark.
The Full System Drive Benchmark comprises of 23 different traces. For the purpose of presenting results, we classify them under five different categories:
- Boot: Replay of storage access trace recorded while booting Windows 10
- Creative: Replay of storage access traces recorded during the start up and usage of Adobe applications such as Acrobat, After Effects, Illustrator, Premiere Pro, Lightroom, and Photoshop.
- Office: Replay of storage access traces recorded during the usage of Microsoft Office applications such as Excel and Powerpoint.
- Gaming: Replay of storage access traces recorded during the start up of games such as Battlefield V, Call of Duty Black Ops 4, and Overwatch.
- File Transfers: Replay of storage access traces (Write-Only, Read-Write, and Read-Only) recorded during the transfer of data such as ISOs and photographs.
PCMark 10 also generates an overall score, bandwidth, and average latency number for quick comparison of different drives. The sub-sections in the rest of the page reference the access traces specified in the PCMark 10 Technical Guide.
Booting Windows 10
The read-write bandwidth recorded for each drive in the boo access trace is presented below.
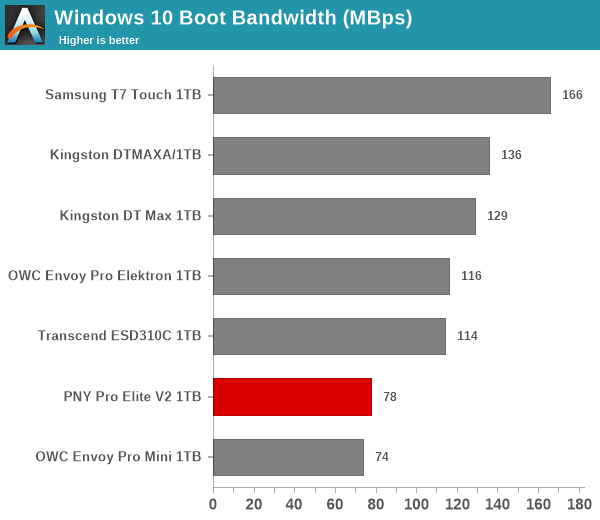
The mixture of low queue depth reads and a few writes in the boot workload seems to work better in the SM2320-based UFDs compared to the Phison U17-based ones. The two in the U17 camp make up the bottom part of the graph.
Creative Workloads
The read-write bandwidth recorded for each drive in the sacr, saft, sill, spre, slig, sps, aft, exc, ill, ind, psh, and psl access traces are presented below.
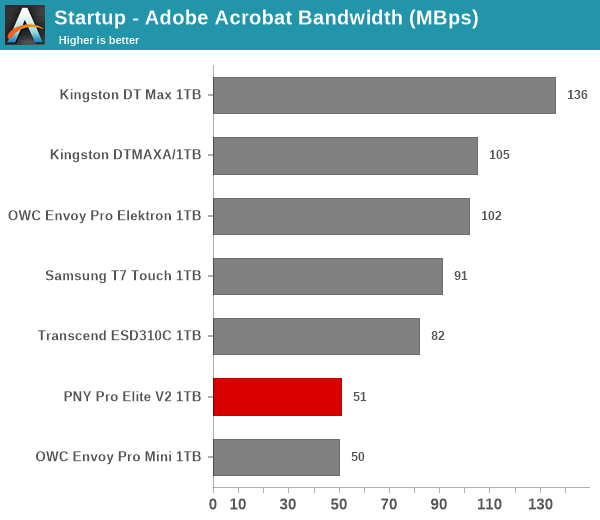
Creative workloads involve a mixture of reads and writes, and bridge-based solutions offer better performance for such scenarios. The PNY Pro Elite V2 comes in second from the last in all of them. The OWC Envoy Pro Mini is likely handicapped by thermal throttling, while the Pro Elite V2 is limited purely by the U17 controller performance.
Office Workloads
The read-write bandwidth recorded for each drive in the exc and pow access traces are presented below.
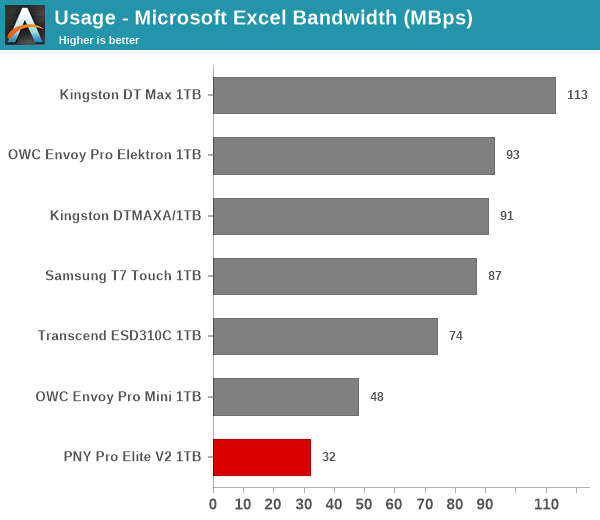
The performance in office workloads is similar to what was seen in the creative workloads set. The Pro Elite V2 fares worse than the OWC Envoy Pro Mini in both components, though not by much. The gulf between them and the SM2320-based Transcend ESD310C is also not too wide, but the other bridge-based solutions have a performance consistency that is only to be expected.
Gaming Workloads
The read-write bandwidth recorded for each drive in the bf, cod, and ow access traces are presented below.
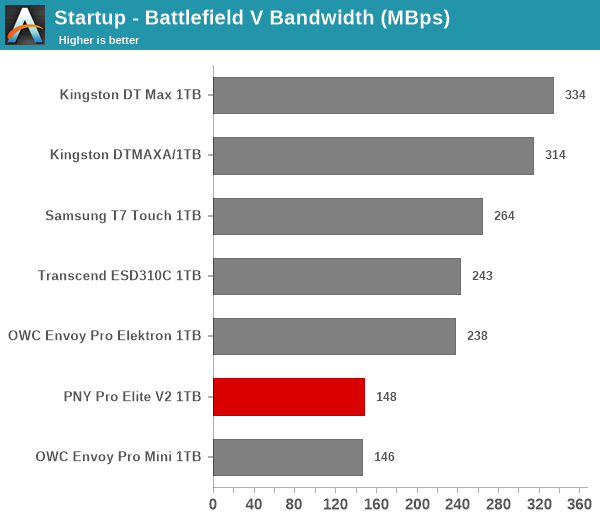
The U17-based PSSDs are both at the bottom of the pack here, with a mixture of sequential and random reads (more of the former) not being particularly performance-friendly for the PNY Pro Elite V2 and the OWC Envoy Pro Mini.
Files Transfer Workloads
The read-write bandwidth recorded for each drive in the cp1, cp2, cp3, cps1, cps2, and cps3 access traces are presented below.
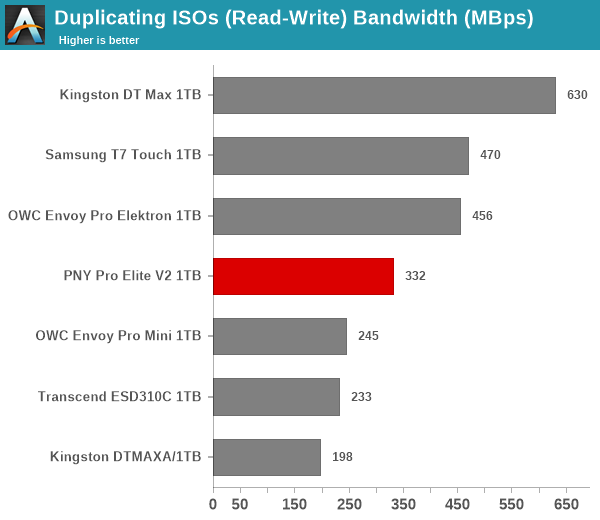
In many of the workloads, the Pro Elite V2 gets itself into the middle of the pack as the other native UFD controller-based solutions battle it outh with thermal throttling or running out of SLC cache.
Overall Scores
PCMark 10 reports an overall score based on the observed bandwidth and access times for the full workload set. The score, bandwidth, and average access latency for each of the drives are presented below.
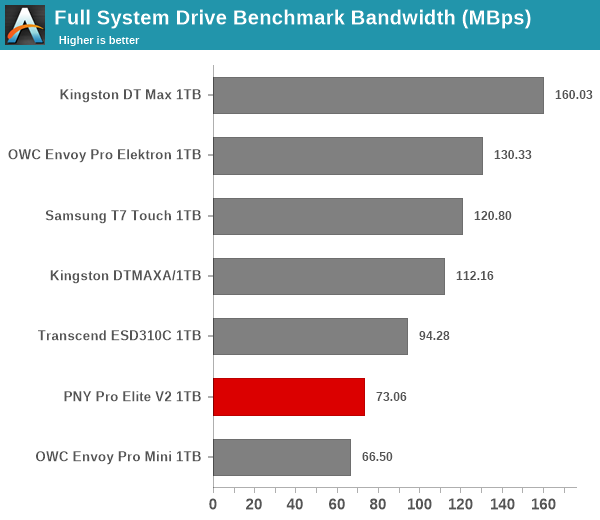
Consistent with the observations made in most of the workload components of the PCMark 10 Storage Bench, the PNY Pro Elite V2 makes up the bottom part of the graphs in this section. Only the much smaller OWC Envoy Pro Mini in a different form-factor (thumb drive) lands below the Pro Elite V2.


4 Comments
View All Comments
garblah - Friday, June 30, 2023 - link
According to the box it supports 4K. That's good to know.But I suppose if you're designing the box art then your target audience is the average walk-in customer at Best Buy or Walmart.
PeachNCream - Tuesday, July 4, 2023 - link
To be fair, uninformed purchasing appears the norm in the US. Why else should marketing work so well on the average person if they'd done any research?evilspoons - Monday, July 10, 2023 - link
Some of your CrystalDiskMark device result screenshots are in IOPS and some are in MB/s. This makes the comparison between the OWC and Kingston 1 TB devices look incredibly lopsided on everything except the SEQ1M test.pipama09 - Wednesday, August 23, 2023 - link
hello