The Toshiba XG6 1TB SSD Review: Our First 96-Layer 3D NAND SSD
by Billy Tallis on September 6, 2018 8:15 AM ESTMixed Random Performance
Our test of mixed random reads and writes covers mixes varying from pure reads to pure writes at 10% increments. Each mix is tested for up to 1 minute or 32GB of data transferred. The test is conducted with a queue depth of 4, and is limited to a 64GB span of the drive. In between each mix, the drive is given idle time of up to one minute so that the overall duty cycle is 50%.
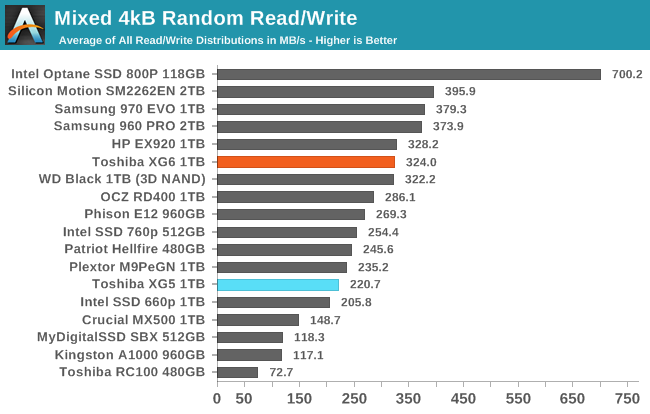
The mixed random I/O performance of the Toshiba XG6 jumps by about 47% compared to the XG5, making it competitive with most current high-end TLC drives.
 |
|||||||||
| Power Efficiency in MB/s/W | Average Power in W | ||||||||
Thanks to the big performance boost at almost no cost in added power consumption, the Toshiba XG6 takes an 11% lead over the nearest competition in power efficiency on this test.
 |
|||||||||
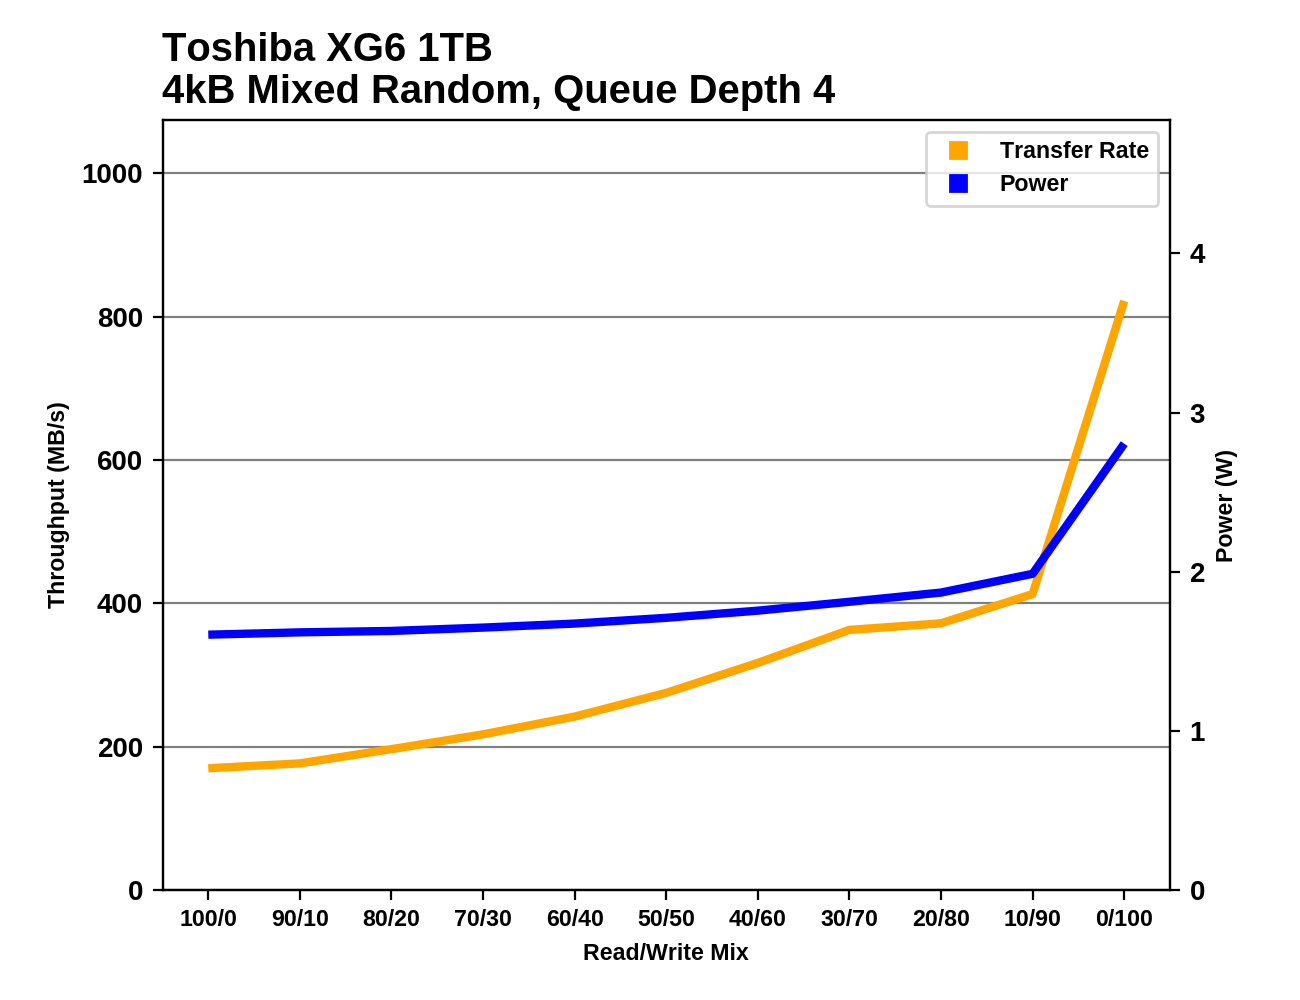
The Toshiba XG6 is able to increase performance throughout the test as more writes are added to the workload, with much more performance growth than the XG5 showed. The performance growth falters a bit near the end of the test but the XG6 still delivers the expected performance spike with the final phase of the test as the workload shifts to pure writes.
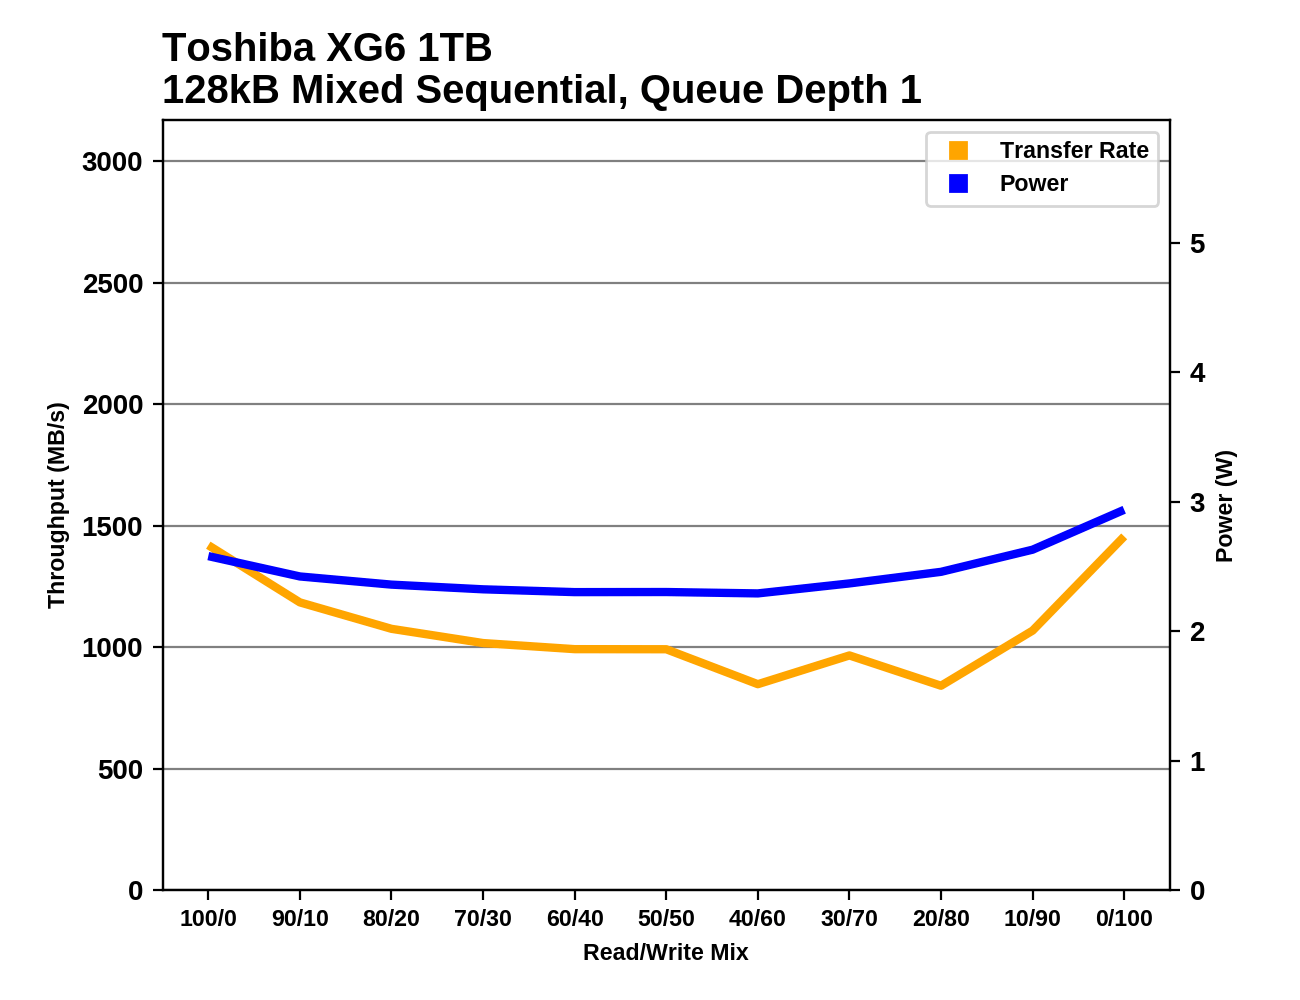
Mixed Sequential Performance
Our test of mixed sequential reads and writes differs from the mixed random I/O test by performing 128kB sequential accesses rather than 4kB accesses at random locations, and the sequential test is conducted at queue depth 1. The range of mixes tested is the same, and the timing and limits on data transfers are also the same as above.
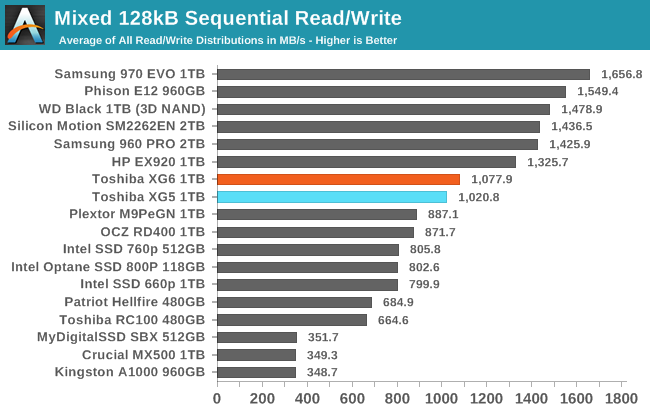
The mixed sequential I/O performance of the XG6 is a bit faster than the XG5, but not enough to boost it up to the top tier of drives. The relatively poor QD1 sequential performance compared to the competition is holding back the XG6 here.
 |
|||||||||
| Power Efficiency in MB/s/W | Average Power in W | ||||||||
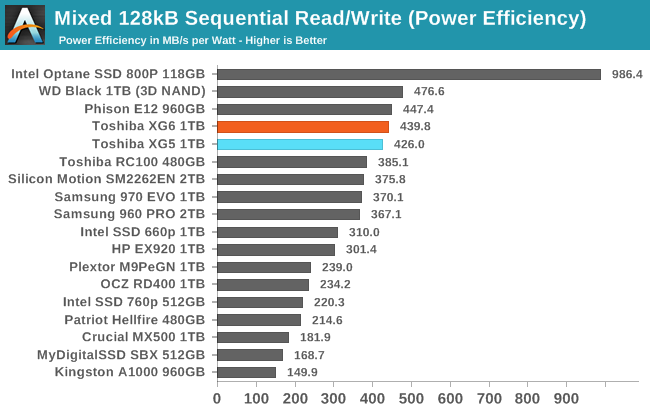
In spite of mid-tier performance, the XG6 still manages very good power efficiency that is a bit better than the XG5 and not too far behind the WD Black. However, the XG6 will also soon be beat by numerous upcoming Phison E12 drives even if the latter are still using the older 64-layer Toshiba 3D TLC.
 |
|||||||||
Slow QD1 read speeds are the main factor keeping the XG6 from matching the overall performance scores of the top tier of drives. The XG6 also shows a bit of performance variation during the second half of the test due to garbage collection or a full SLC cache, but the impact is not severe.


31 Comments
View All Comments
Spoelie - Thursday, September 6, 2018 - link
2 short questions:- what happened to the plextor M9Pe, performance is hugely different from the review back in march.
- i know this is already the case for a year or so, but what happened to the perf consistency graphs, where can i deduce the same information from?
hyno111 - Thursday, September 6, 2018 - link
M9Pe had firmware updates, not sure if it's applied or related though.DanNeely - Thursday, September 6, 2018 - link
I don't recall the details, but something went wrong with generating the performance consistency data, and they were pulled pending finding a fix due to concerns they were no longer valid. IF you have the patience to dig through the archive, IIRC the situation was explained in the first review without them.Billy Tallis - Thursday, September 6, 2018 - link
I think both of those are a result of me switching to a new version of the test suite at the same time that I applied the Spectre/Meltdown patches and re-tested everything. The Windows and Linux installations were updated, and a few tweaks were made to the synthetic test configuration (such as separating the sequential read results according to whether the test data was written sequentially or randomly). I also applied all the drive firmware updates I could find in the April-May timeframe.The steady-state random write test as it existed a few years ago is gone for good, because it really doesn't say anything relevant about drives that use SLC caching, which is now basically every consumer SSD (except Optane and Samsung MLC drives). I also wasn't too happy with the standard deviation-based consistency metric, because I don't think a drive should be penalized for occasionally being much faster than normal, only much slower than normal.
To judge performance consistency, I prefer to look at the 99th percentile latencies for the ATSB real-world workload traces. Those tend to clearly identify which drives are subject to stuttering performance under load, without exaggerating things as much as an hour-long steady-state torture test.
I may eventually introduce some more QoS measures for the synthetic tests, but at the moment most of them aren't set up to produce meaningful latency statistics. (Testing at a fixed queue depth leads to the coordinated omission problem, potentially drastically understating the severity of things like garbage collection pauses.) At some point I'll also start graphing the performance as a drive is filled, but with the intention of observing things like SLC cache sizes, not for the sake of seeing how the drive behaves when you keep torturing it after it's full.
I will be testing a few consumer SSDs for one of my upcoming enterprise SSD reviews, and that will include steady-state full drive performance for every test.
svan1971 - Thursday, September 6, 2018 - link
I wish current reviews would use current hardware, the 970 Pro replaced the 960 Pro months ago.Billy Tallis - Thursday, September 6, 2018 - link
I've had trouble getting a sample of that one; Samsung's consumer SSD sampling has been very erratic this year. But the 970 Pro is definitely a different class of product from a mainstream TLC-based drive like the XG6. I would only include 970 Pro results here for the same reason that I include Optane results. They're both products for people who don't really care about price at all. There's no sensible reason to be considering a 970 Pro and an XG6-like retail drive as both potential choices for the same purchasing decision.mapesdhs - Thursday, September 6, 2018 - link
Please never stop including older models, the comparisons are always useful. Kinda wish the 950 Pro was in there too.Spunjji - Friday, September 7, 2018 - link
I second this. I know that I am (and feel most other savvy consumers would be) more likely to compare an older high-end product to a newer mid-range product, partly to see if it's worth buying the older gear at a discount and partly to see when there is no performance trade-off in dropping a cost tier.jajig - Friday, September 7, 2018 - link
I third it. I want to know if an upgrade is worth while.dave_the_nerd - Sunday, September 9, 2018 - link
Very much this. And not all of us upgrade our gear every year or two.