AMD’s New EPYC 7F52 Reviewed: The F is for ᴴᴵᴳᴴ Frequency
by Dr. Ian Cutress on April 14, 2020 9:45 AM EST- Posted in
- CPUs
- AMD
- Enterprise
- Enterprise CPUs
- EPYC
- SP3r2
- CPU Frequency
- Rome
- 7Fx2
Frequency Ramp, Latency and Power
Frequency Ramp
One of the key items of a modern processor is its ability to go from an idle state up to a peak turbo state. For consumer workloads this is important for the responsiveness of a system, such as opening a program or interacting with a web page, but for the enterprise market it ends up being more relevant when each core can control its turbo, and we get situations with either multi-user instances or database accesses. For these systems, obviously saving power helps with the total cost of ownership, but being able to offer a low latency transaction in that system is often a key selling point.
For our 7F52 system, we measured a jump up to peak frequency within 16.2 milliseconds, which links in really well with the other AMD systems we have tested recently.
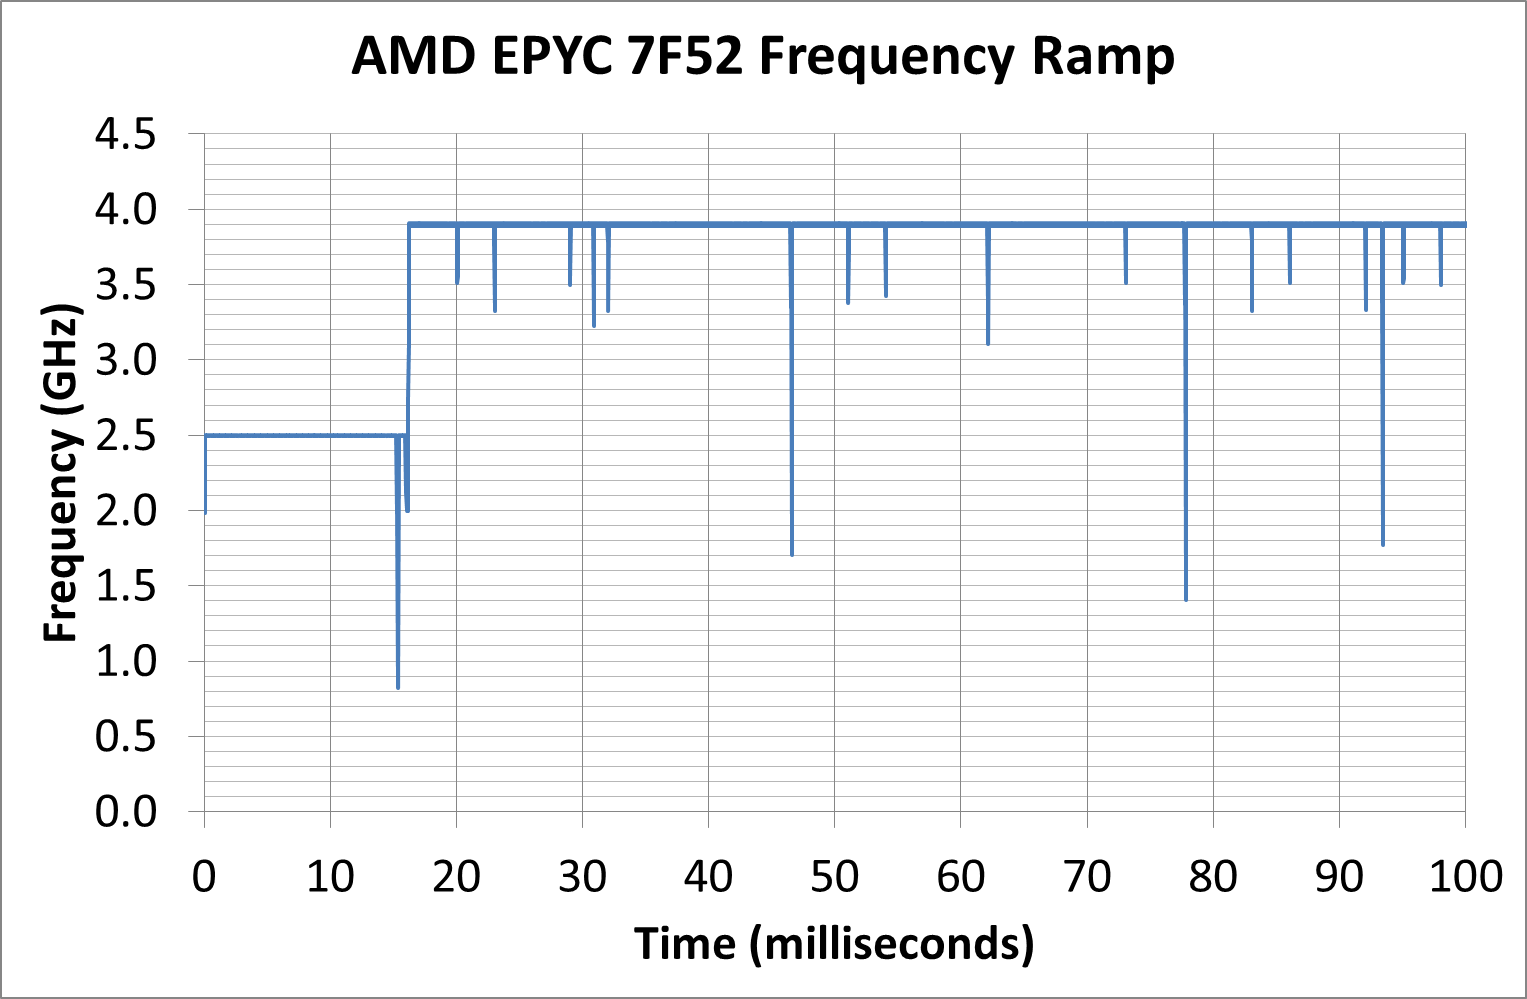
In a consumer system, normally we would point out that 16 milliseconds is the equivalent to a single frame on a 60 Hz display, although for enterprise it means that any transaction normally done within 16 milliseconds on the system is a very light workload that might not even kick up the turbo at all.
Cache Latency
As we’ve discussed in the past, the key element about Cache Latency on the AMD EPYC systems is the L3 cache – the way these cores are designed, with the quad-core core complexes, means that the only L3 each core can access is that within its own CCX. That means for every EPYC CPU, whether there is four cores per CCX enabled, or if there is only one core per CCX enabled, it only has access to 16 MB of L3. The fact that there is 256 MB across the whole chip is just a function of repeating units. As a result, we can get a cache latency graph of the following:

This structure mirrors up with what we’ve seen in AMD CPUs in the past. What we get here for the 7F52 is:
- 1.0 nanoseconds for L1 (4 clks) up to 32 KB
- 3.3 nanoseconds for L2 (13 clks) up to 256 KB,
- 4.8-5.6 nanoseconds (19-21 clks) at 256-512 KB (Accesses starting to miss the L1 TLB here)
- 12-14 nanoseconds (48-51 clks) from 1 MB to 8 MB inside the first half the CCX L3
- Up to 37 nanoseconds (60-143 clks) at 8-16 MB for the rest of the L3
- ~150 nanoseconds (580-600+ clks) from 16 MB+ moving into DRAM
Compared to one of our more recent tests, Ryzen Mobile, we see the bigger L3 cache structure but also going beyond the L3 into DRAM, due to the hop to the IO die and then out to the main memory there’s a sizeable increase in latency in accessing main memory. It means that for those 600 or so cycles, the core needs to be active doing other things. As the L3 only takes L2 cache line rejects, this means there has to be a lot of reuse of L3 data, or cyclical math on the same data, to take advantage of this.
Core-to-Core Latency
By only having one core per CCX, the 7F52 takes away one segment of its latency structure.
- Thread to Thread in same core: 8 nanoseconds
- Core to Core in same CCX: doesn't apply
- Core to Core in different CCX on same CPU in same quadrant: ~110 nanoseconds
- Core to Core in different CCX on same CPU in different socket quadrant: 130-140 nanoseconds
- Core to Core in a different socket: 250-270 nanosecons
All of the Power
Enterprise systems, unlike consumer systems, often have to adhere to a strict thermal envelope for the server and chassis designs that they go into. This means that, even in a world where there’s a lot of performance to be gained from having a fast turbo, the sustained power draw of these processors is mirrored in the TDP specifications of that processor. The chip may offer sustained boosts higher than this, which different server OEMs can design for and adjust the BIOS to implement, however the typical expected performance when ‘buying a server off the shelf’ is that if the chip has a specific TDP value, that will be the sustained turbo power draw. At that power, the system will try and implement the highest frequency it can, and depending on the microarchitecture of the power delivery, it might be able to move specific cores up and down in frequency if the workload is lighter on other cores.
By contrast, consumer grade CPUs will often boost well beyond the TDP label, to the second power limit as set in the BIOS. This limit is different depending on the motherboard, as manufacturers will design their motherboards beyond Intel specifications in order to supplement this.
For our power numbers, we take the CPU-only power draw at both idle and when running a heavy AVX2 load.
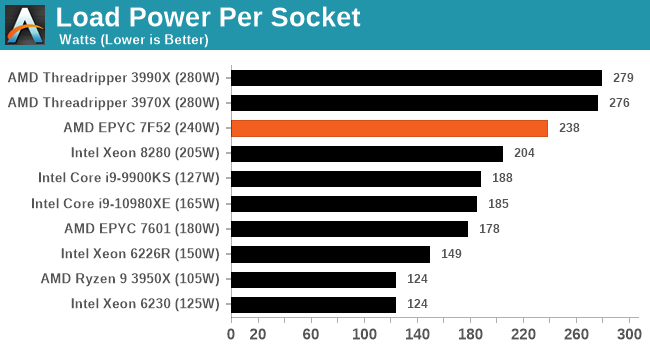
When we pile on the calories, all of our enterprise systems essentially go to TDPmax mode, with every system being just under the total TDP. The consumer processors give it a bit more oomph by contrast, being anywhere from 5-50% higher.
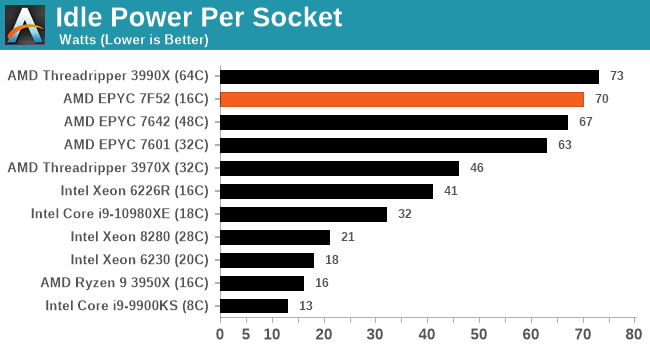
In our high performance power plan, the AMD CPUs idle quite high compared to the Intel CPUs – both of our EPYC setups are at nearly 70 W per processor a piece, while the 32C Threadripper is in about that 45 W region. Intel seems to aggressively idle here.


97 Comments
View All Comments
Santoval - Thursday, April 16, 2020 - link
"This cpu line is low margin and unable to seriously beat Intel big superiority in raw core performance."Zen 2 based servers CPUs already beat Intel in "raw core performance". This "F" series AMD introduced is not meant to beat Intel, since they already have. It is meant for certain customers who want fewer but faster cores/threads. Examples might be high-end workstations rather than servers (or workstations disguised as servers), which scale well up up to 16 - 24 cores and do not need CPUs with 32 - 64 cores which provide less performance per core as a trade-off.
As for the server market share AMD is going to exceed -or rather, *was* going to exceed, before Covid-19 froze everything -a 10% market share in Q2 2020 already (rather than a mere 5%). Source (in the 8th paragraph) :
https://www.forbes.com/sites/tiriasresearch/2020/0...
tyleeds - Thursday, April 16, 2020 - link
We used to custom order for customers what we called "The Oracle Special". Due to the way Oracle lays out their licensing on the database, you're looking for relatively low core counts, but screaming fast with a lot of cache. The price of Oracle licensing means you can safely say "power be damned" and just get the fastest core you can manage.This looks a lot like that...
Lord of the Bored - Monday, April 20, 2020 - link
"Intel on 14nm""AMD are late a lot"
You, sir, are a comedy genius!
schujj07 - Tuesday, April 14, 2020 - link
Yes the Intel counterpart is on 14nm and has a 205W TDP, but as we all know Intel's TDP is only measured off of base clock. During actual usage its TDP is much higher than 205W. This is why we see the Threadripper 3970X using less power than the 18 core Intel 10980XE even though the 10980 has a much lower TDP. https://www.servethehome.com/amd-ryzen-threadrippe... For here the 7F52 has higher performance than the 6246R and when you have workloads that are frequency sensitive that extra power doesn't matter as much.Deicidium369 - Tuesday, April 14, 2020 - link
Their server CPUs are a different thing than the desktop - You give people a little bit of info and all of a sudden they are freaking experts on power usage. So 205 is 205. NO ONE overclocks server CPUseek2121 - Tuesday, April 14, 2020 - link
It actually has little to do with overclocking on the Intel side. A stock Core i9 9900K will blow through it’s limit (both power and heat) with the vast majority of motherboards out there today.Their server CPUs, however, adhere to TDP.
schujj07 - Tuesday, April 14, 2020 - link
Not exactly true when there is a load. Max draw on dual 8280's is 685.1W for a 205W TDP. Due to the boost nature, the CPU will draw a lot more power. https://www.tomshardware.com/reviews/intel-cascade...Note the Epyc also draws more than its TDP as well and the review doesn't say whether this is total system or just CPU.
Oxford Guy - Saturday, April 18, 2020 - link
Reviewers or someone...There needs to be serious pressure to create a triple metric.
1. Maximum power the CPU can draw with a synthetic workload that maxes it as completely as possible.
2. Maximum power the CPU can draw with a real-world program (come up with an industry consensus).
3. For consumer CPUs: Maximum power the CPU can draw using the world's most demanding real-world gaming title. For prosumer and enterprise CPUs: Maximum power the CPU can draw with a second real-world program that is very different from the other one.
Stop enabling useless metrics that don't match reality.
bug77 - Tuesday, April 14, 2020 - link
And this is despite you having power measured on the second page of this review.schujj07 - Tuesday, April 14, 2020 - link
The chip on the 2nd page is the 6226R which will not compete with the 7F52. The competing chip from Intel is the 6246R.https://ark.intel.com/content/www/us/en/ark/produc... - 6226R
https://ark.intel.com/content/www/us/en/ark/produc... -6246R
The added 500MHz base clock brings the TDP from 150W to 205W.