The Phison E12 Reference Design Preview: A Next-Gen NVMe SSD Controller
by Billy Tallis on July 18, 2018 10:30 AM ESTSequential Read Performance
Our first test of sequential read performance uses short bursts of 128MB, issued as 128kB operations with no queuing. The test averages performance across eight bursts for a total of 1GB of data transferred from a drive containing 16GB of data. Between each burst the drive is given enough idle time to keep the overall duty cycle at 20%.
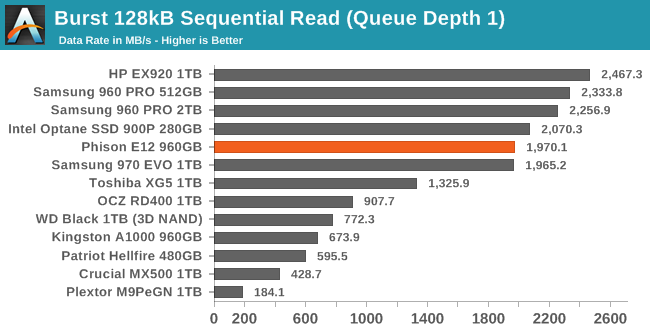
The burst sequential read performance of the Phison E12 is just shy of 2GB/s—much better than most TLC SSDs, but the HP EX920 has a pretty big lead at 2.4GB/s.
Our test of sustained sequential reads uses queue depths from 1 to 32, with the performance and power scores computed as the average of QD1, QD2 and QD4. Each queue depth is tested for up to one minute or 32GB transferred, from a drive containing 64GB of data. This test is run twice: once with the drive prepared by sequentially writing the test data, and again after the random write test has mixed things up, causing fragmentation inside the SSD that isn't visible to the OS. These two scores represent the two extremes of how the drive would perform under real-world usage, where wear leveling and modifications to some existing data will create some internal fragmentation that degrades performance, but usually not to the extent shown here.
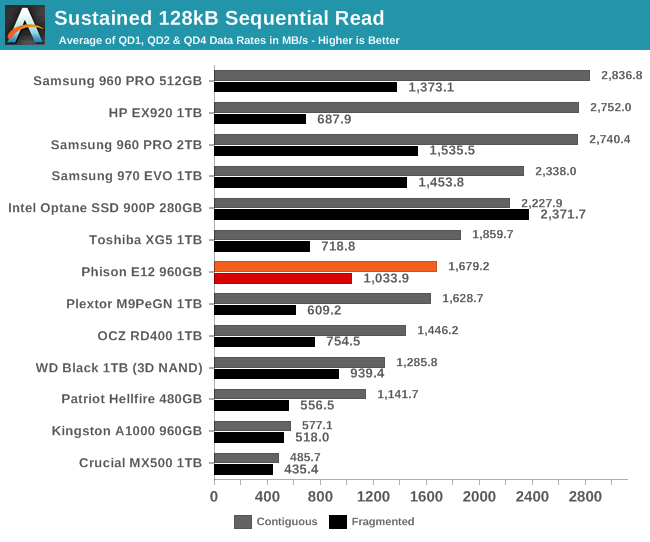
On the longer sequential read test, the Phison E12 doesn't keep pace, and it isn't even the fastest controller for this kind of NAND: the Toshiba XG5 is a bit faster. The E12's performance doesn't suffer acutely from internal fragmentation like the SM2262-based HP EX920 does.
 |
|||||||||
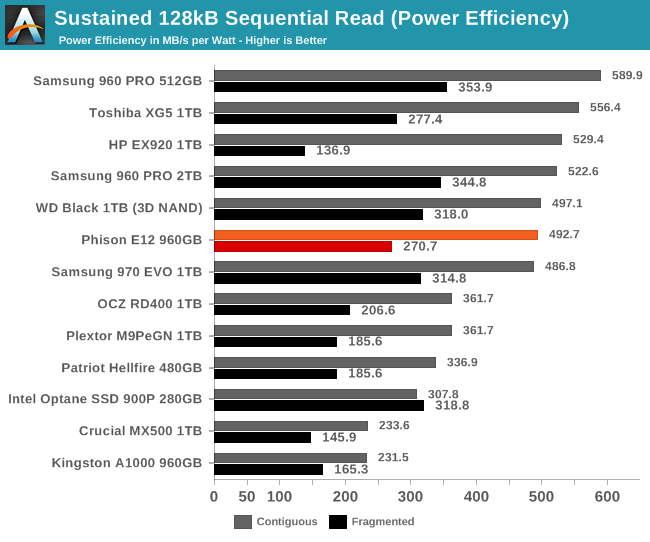
| Power Efficiency in MB/s/W | Average Power in W | ||||||||
The Phison E12 is reasonably power efficient on the sequential read test, but it doesn't stand out from the crowd. It is one of the few drives that draws more power when reading from a data with internal fragmentation, because that fragmentation slows most drives down to the point that they also start drawing less power overall.
 |
|||||||||
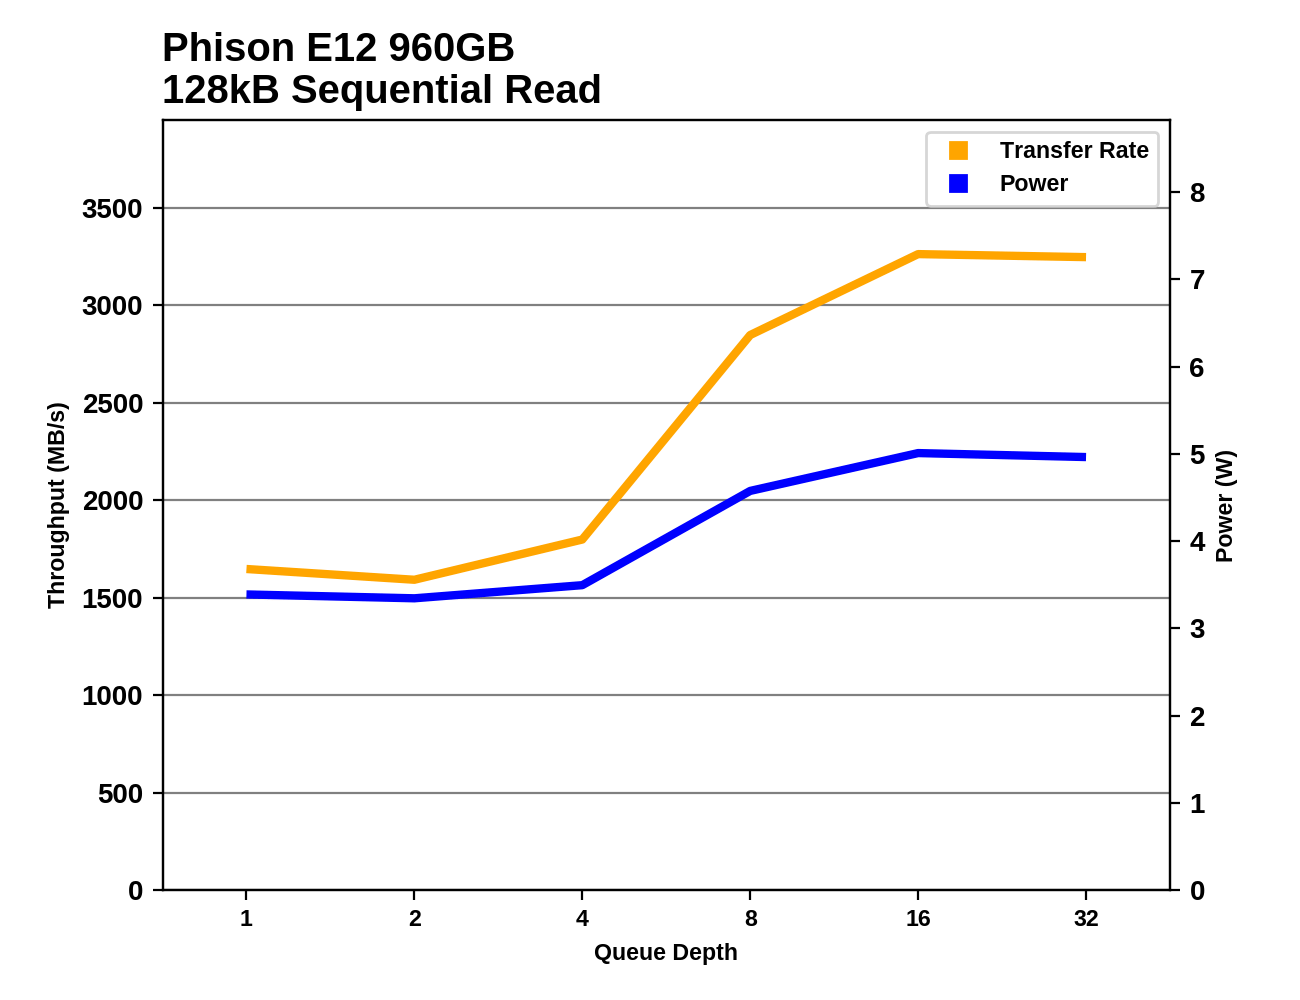
The sequential read performance of the Phison E12 is mostly flat at low queue depths, and then jumps up toward saturation between QD4 and QD16. There are several other drives that require similarly high queue depths to reach full performance, but the HP EX920 does more than 3 GB/s at QD2.
Sequential Write Performance
Our test of sequential write burst performance is structured identically to the sequential read burst performance test save for the direction of the data transfer. Each burst writes 128MB as 128kB operations issued at QD1, for a total of 1GB of data written to a drive containing 16GB of data.
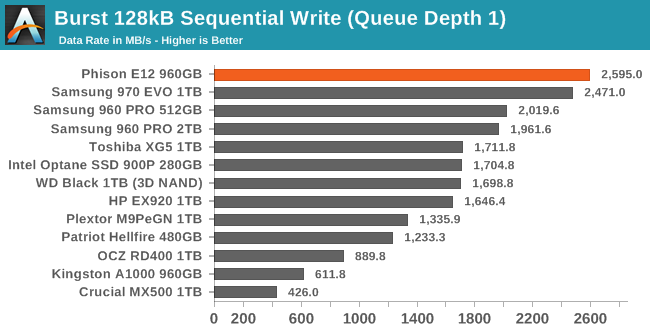
After seeing the Phison E12 set a record for burst random writes, it is not too surprising to see it also set the record for burst sequential write performance. Second place goes to the Samsung 970 EVO, and then it's a long way down to the next fastest TLC drive.
Our test of sustained sequential writes is structured identically to our sustained sequential read test, save for the direction of the data transfers. Queue depths range from 1 to 32 and each queue depth is tested for up to one minute or 32GB, followed by up to one minute of idle time for the drive to cool off and perform garbage collection. The test is confined to a 64GB span of the drive.
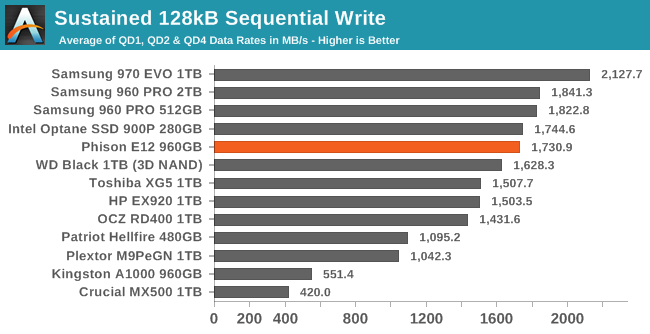
On the longer sequential write test, the Phison E12 doesn't hold on to its performance as well as the Samsung 970 EVO does, but the E12 still manages to stay ahead of the rest of the TLC drives.
 |
|||||||||
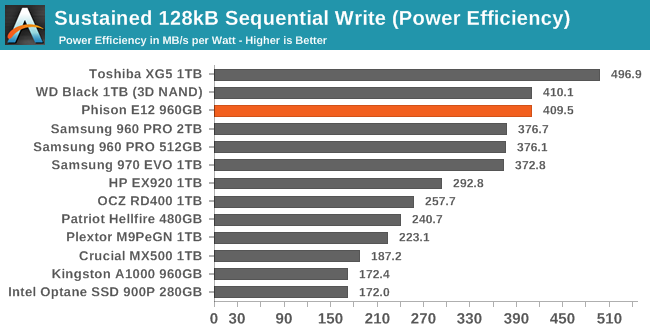
| Power Efficiency in MB/s/W | Average Power in W | ||||||||
Several SSDs with BiCS3 3D TLC take the top spots for power efficiency during sequential writes. The Toshiba XG5 is still on top, but the Phison E12 ties the WD Black for second place. The E12 uses a bit more power than the WD Black but delivers speed to match.
 |
|||||||||
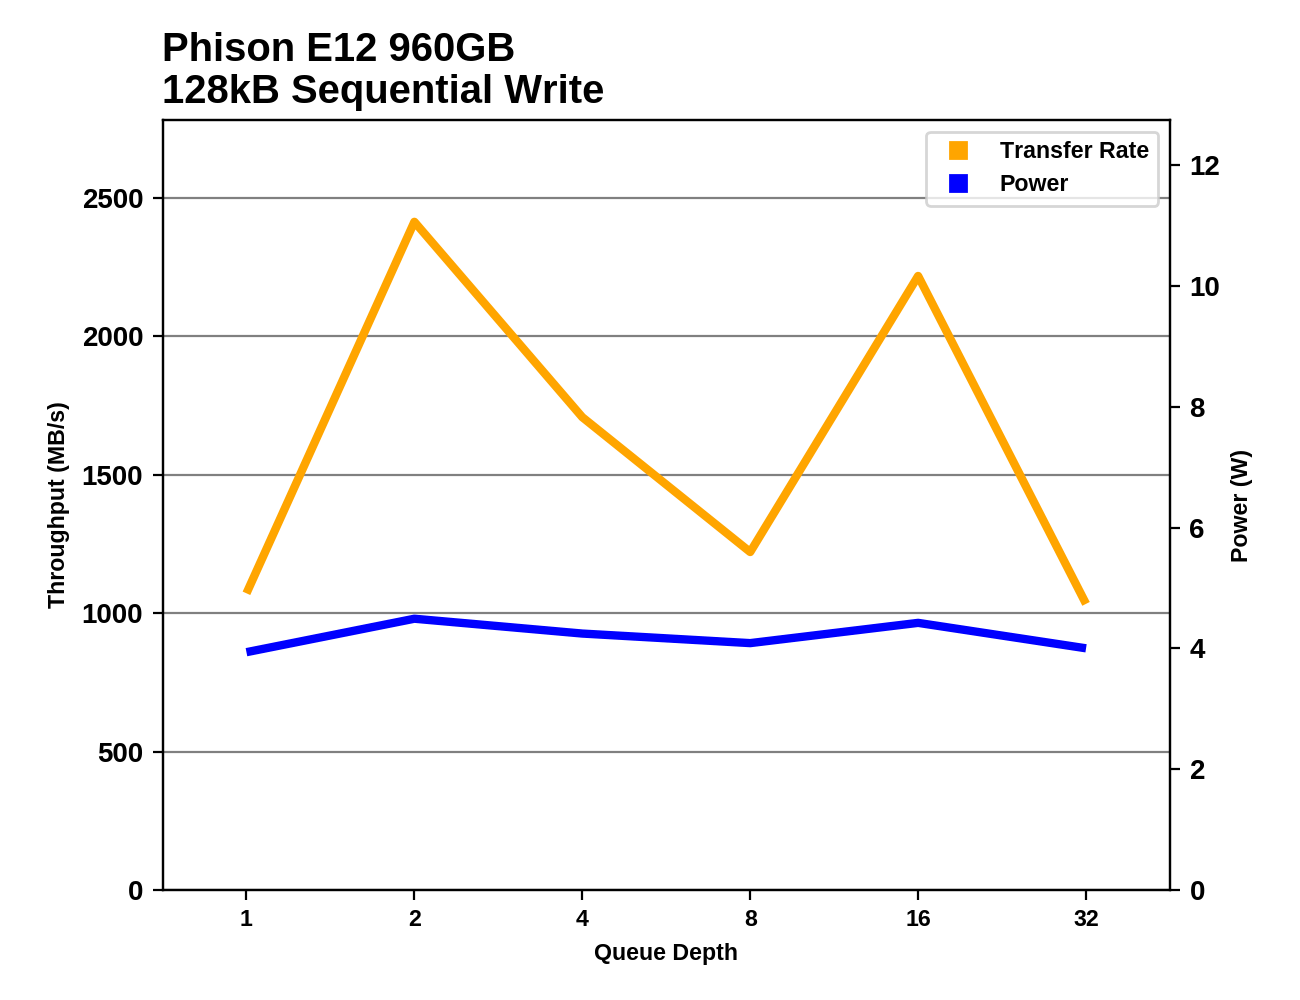
The Phison E12 hits an excellent sequential write speed at QD2, but then bounces around as the drive struggles to complete garbage collection to empty the SLC cache during the idle times between test phases. The drive still stays above 1GB/s, so it isn't slowing down to anywhere near SATA speeds. Power consumption varies little; the drive is 100% busy writing to the flash throughout the test phases, even when a significant portion of those writes aren't new data coming in from the host system.


28 Comments
View All Comments
gglaw - Thursday, July 19, 2018 - link
new cheap competition is exactly what the market needs. I've posted this before but the pursuit of performance for most of the readers here is pretty much wasted unless i've gotten so insensitive to speed changes I can't tell the difference anymore. I have more computers that I'm embarassed to admit to and more parts than I have time to finish building more to test. SSD's in general I wouldn't be surprised if I've tested more than the whole AT staff literally, and not just running a few hours of the same suites, hundreds of hours through my LAN room. I've had every major SSD chipset released for at least several years and within I'd say the last 2-3 years I can tell absolutely no difference between the cheapest 3D NAND SATA drive and the 970 EVO and ADATA 8200 which is a gem most people haven't even heard of that are among the fastest drives ever produced for consumer use. My slowest drives are the Micron 2TB dirt cheap $250 drives that go on sale every 2 weeks (cheapest per GB drive ever made), a couple Crucial MX 3D NAND drives, a few enterprise Samsung/HP pulls that are actually brand new sold through Newegg outlet, and some Samsung 850 non-pro's. Especially on the Destroyer tests the numbers look dramatically different, but this test is absolutely useless for at least 99% of the users on this site other than the few big organization admins who frequent these comments routinely.No one including myself through hundreds of hours through my LAN room have noticed/commented on any speed difference running Twitch/streaming, chat engines, browsers, while doing many hours of OW, WOW, HOTS, and Steam library games. This is about the intensity of use of the vast, vast majority of the public, likely moreso. Now other than my one flagship with about the fastest you can get of every piece, all I go for is cheap $/GB and decent warranty on my SSD's. My current flagship is the top Ryzen2, ADATA 8200 NVME drive (basically same as 970 EVO which is in my Coffee Lake rig), GTX 1080 - and sadly the only noticeable difference is playability on higher graphics settings due to the GTX 1080s on the higher machines. The 16 threaded CPU and turbo SSD's no one can tell is even in the box. And the budget machines running RX 580s, GTX 1070s/1060s, do everything identical to the flagships other than a couple graphics settings needing to be turned down. (All the rigs are also only going at 1440p since I never felt it was enough of a difference to justify the cost to go 4k).
romrunning - Thursday, July 19, 2018 - link
The only point I think you've established is that you haven't run any loads that significantly use any one component - SSD, CPU, or GPU. Well, at least you saw the GPU difference in "higher settings". If you're just doing games, I can see why you might think the big performance products don't have much of an impact. However, depending on your use case, there can be huge performance/time savings in different products.A high-thread count CPU can make significant time differences in rendering. So if that is something you do a lot, especially if you do this for work, then you will notice a huge difference in the time saved on rendering.
In virtual server hosts, you can tell a difference from an all-SSD array vs all-HDD array in the responsive of the virtual guests. In databases, you can tell big differences in SSD storage vs HDD storage (not considering memory), especially with disk I/O-intensive backups & restores.
So these are just some use cases that can highlight the significant impact of better-performing components. But all cases are different in their usage scenarios. We can't just give up on seeking better performance & go only for low-cost just because our particular use-case doesn't really display the impact of higher-performing parts.
PeachNCream - Thursday, July 19, 2018 - link
I think the point of the post you were responding to was to argue that there is little real world difference in most home computing scenarios between different SSDs (not SSDs vs HDDs as your response points out) despite the benchmarks showing sometimes dramatic performance advantages or disadvantages. The other accompanying parts of the post that wander into the CPU and GPU were just there to enhance the credibility of the claim by offering an argument of broad experience.romrunning - Thursday, July 19, 2018 - link
I, too, wish for more performance MLC products; however, I think we might just transition to Optane drives & hope they go down faster in price.The_Assimilator - Thursday, July 19, 2018 - link
Article title: "A Next-Gen NVMe SSD Controller"Article conclusion: "...it doesn't appear that the combination of the E12 controller and 64L TLC is at all future-proof."
shabby - Thursday, July 19, 2018 - link
Need a catchy title for them clicks.Holliday75 - Thursday, July 19, 2018 - link
It is Phison's next gen controller.tygrus - Thursday, July 19, 2018 - link
28nm for the controller isn't new. I assume they could decrease power consumption if they used smaller fab node like 22nm. The FLASH chips themselves use/produce a lot of heat as well and 28nm might be cheaper than 22nm so compromises were made. Maybe they could bring out another version for higher performance AIC PCIe x8 or PCIe v4 signals next year (22nm fabed controller).