The AMD 2nd Gen Ryzen Deep Dive: The 2700X, 2700, 2600X, and 2600 Tested
by Ian Cutress on April 19, 2018 9:00 AM EST
With 2017 finished, and Ryzen being very successful for AMD, the inevitable question was due: what happens next? Early in 2018, the plans were laid bare: a second generation Ryzen processor was set to come in mid-year, followed by a second generation Threadripper, using GlobalFoundries’ 12nm process. This is not AMD’s next big microarchitecture, which we know is called Zen 2 on 7nm, but an opportunity to launch a wave of components with minor improvements and take advantage of a manufacturing process that gives more frequency and more performance. Today AMD is launching four CPUs, and we have tested them all.
Updates
- (4/21) Some of our results, initially thought due to Spectre/Meltdown patches, were not in line with others. Testing audit was started.
- (4/25) Our extensive internal audit showed reasons for the differences, as documented in detail in this follow-up article. In short, an issue with a non-standard use timers on Windows was causing the performance of both AMD and Intel processors to dip, particularly impacting the latter.
- (5/2) Benchmark results have been updated.
- (5/22) X470 Motherboard. StoreMI, and Power Analysis pages updated.
- (5/26) Conclusion Updated, Performance Per Dollar graphs added.
Straight To The Scene: The New CPUs
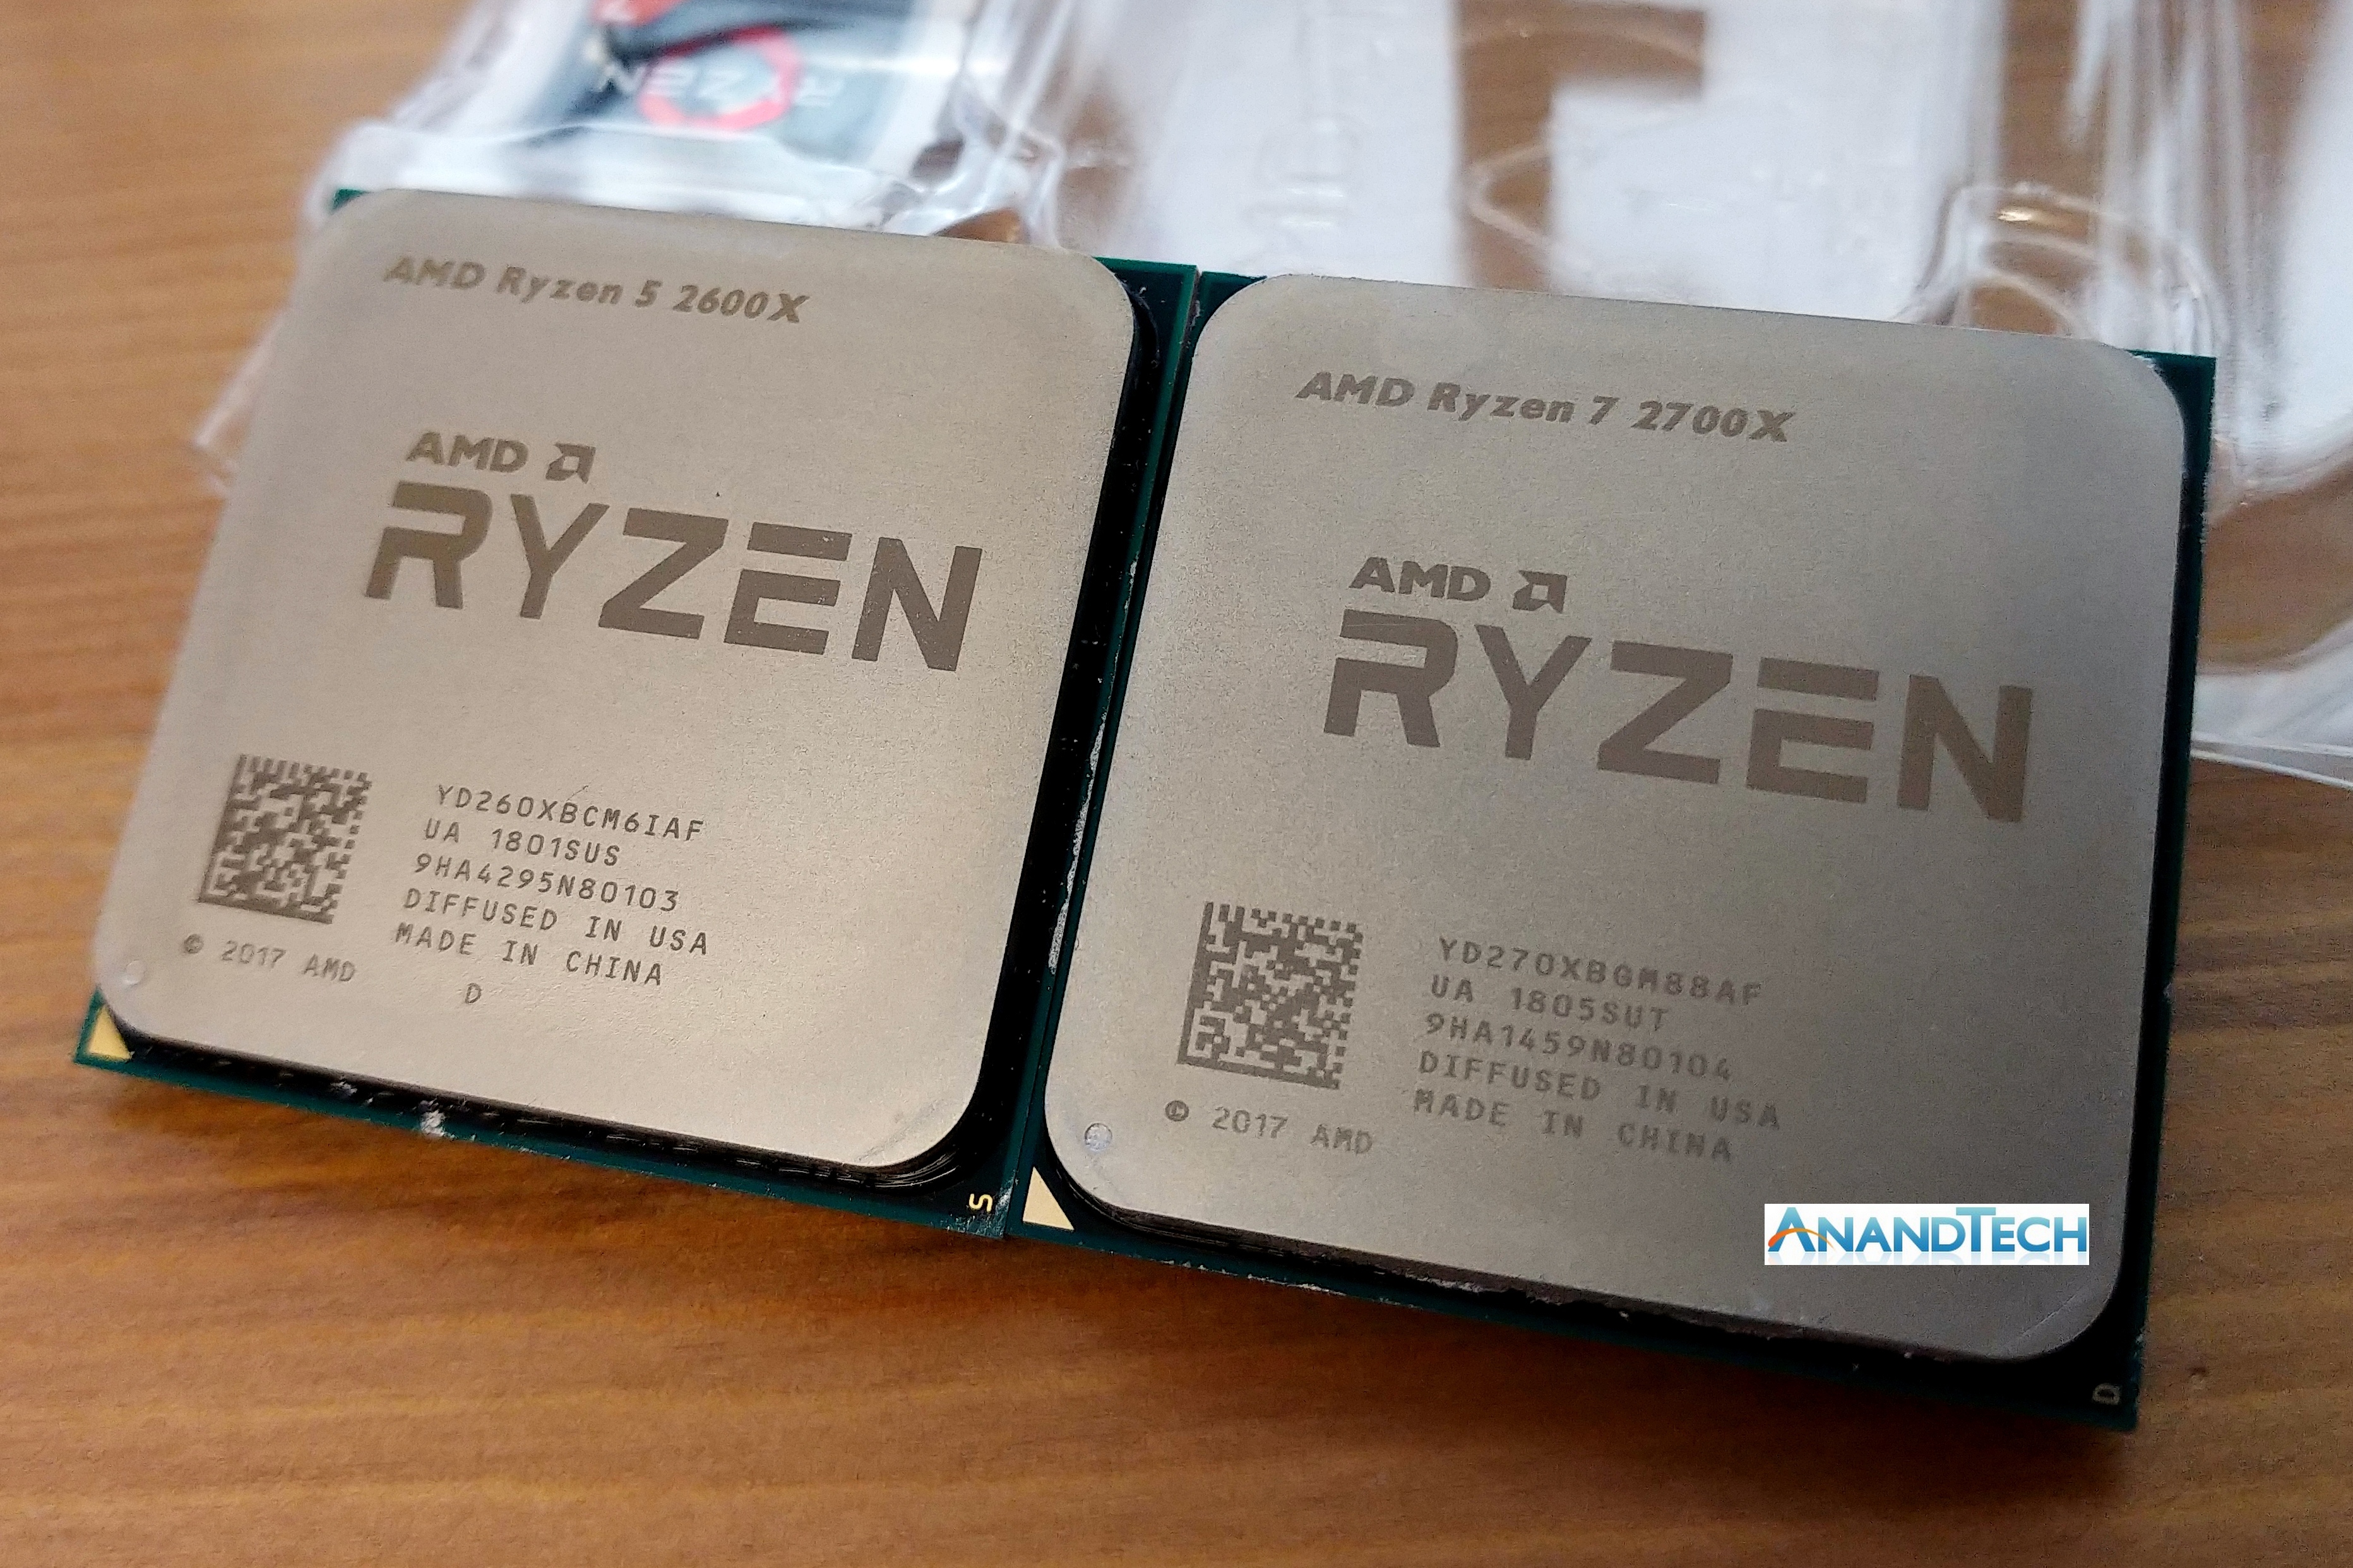
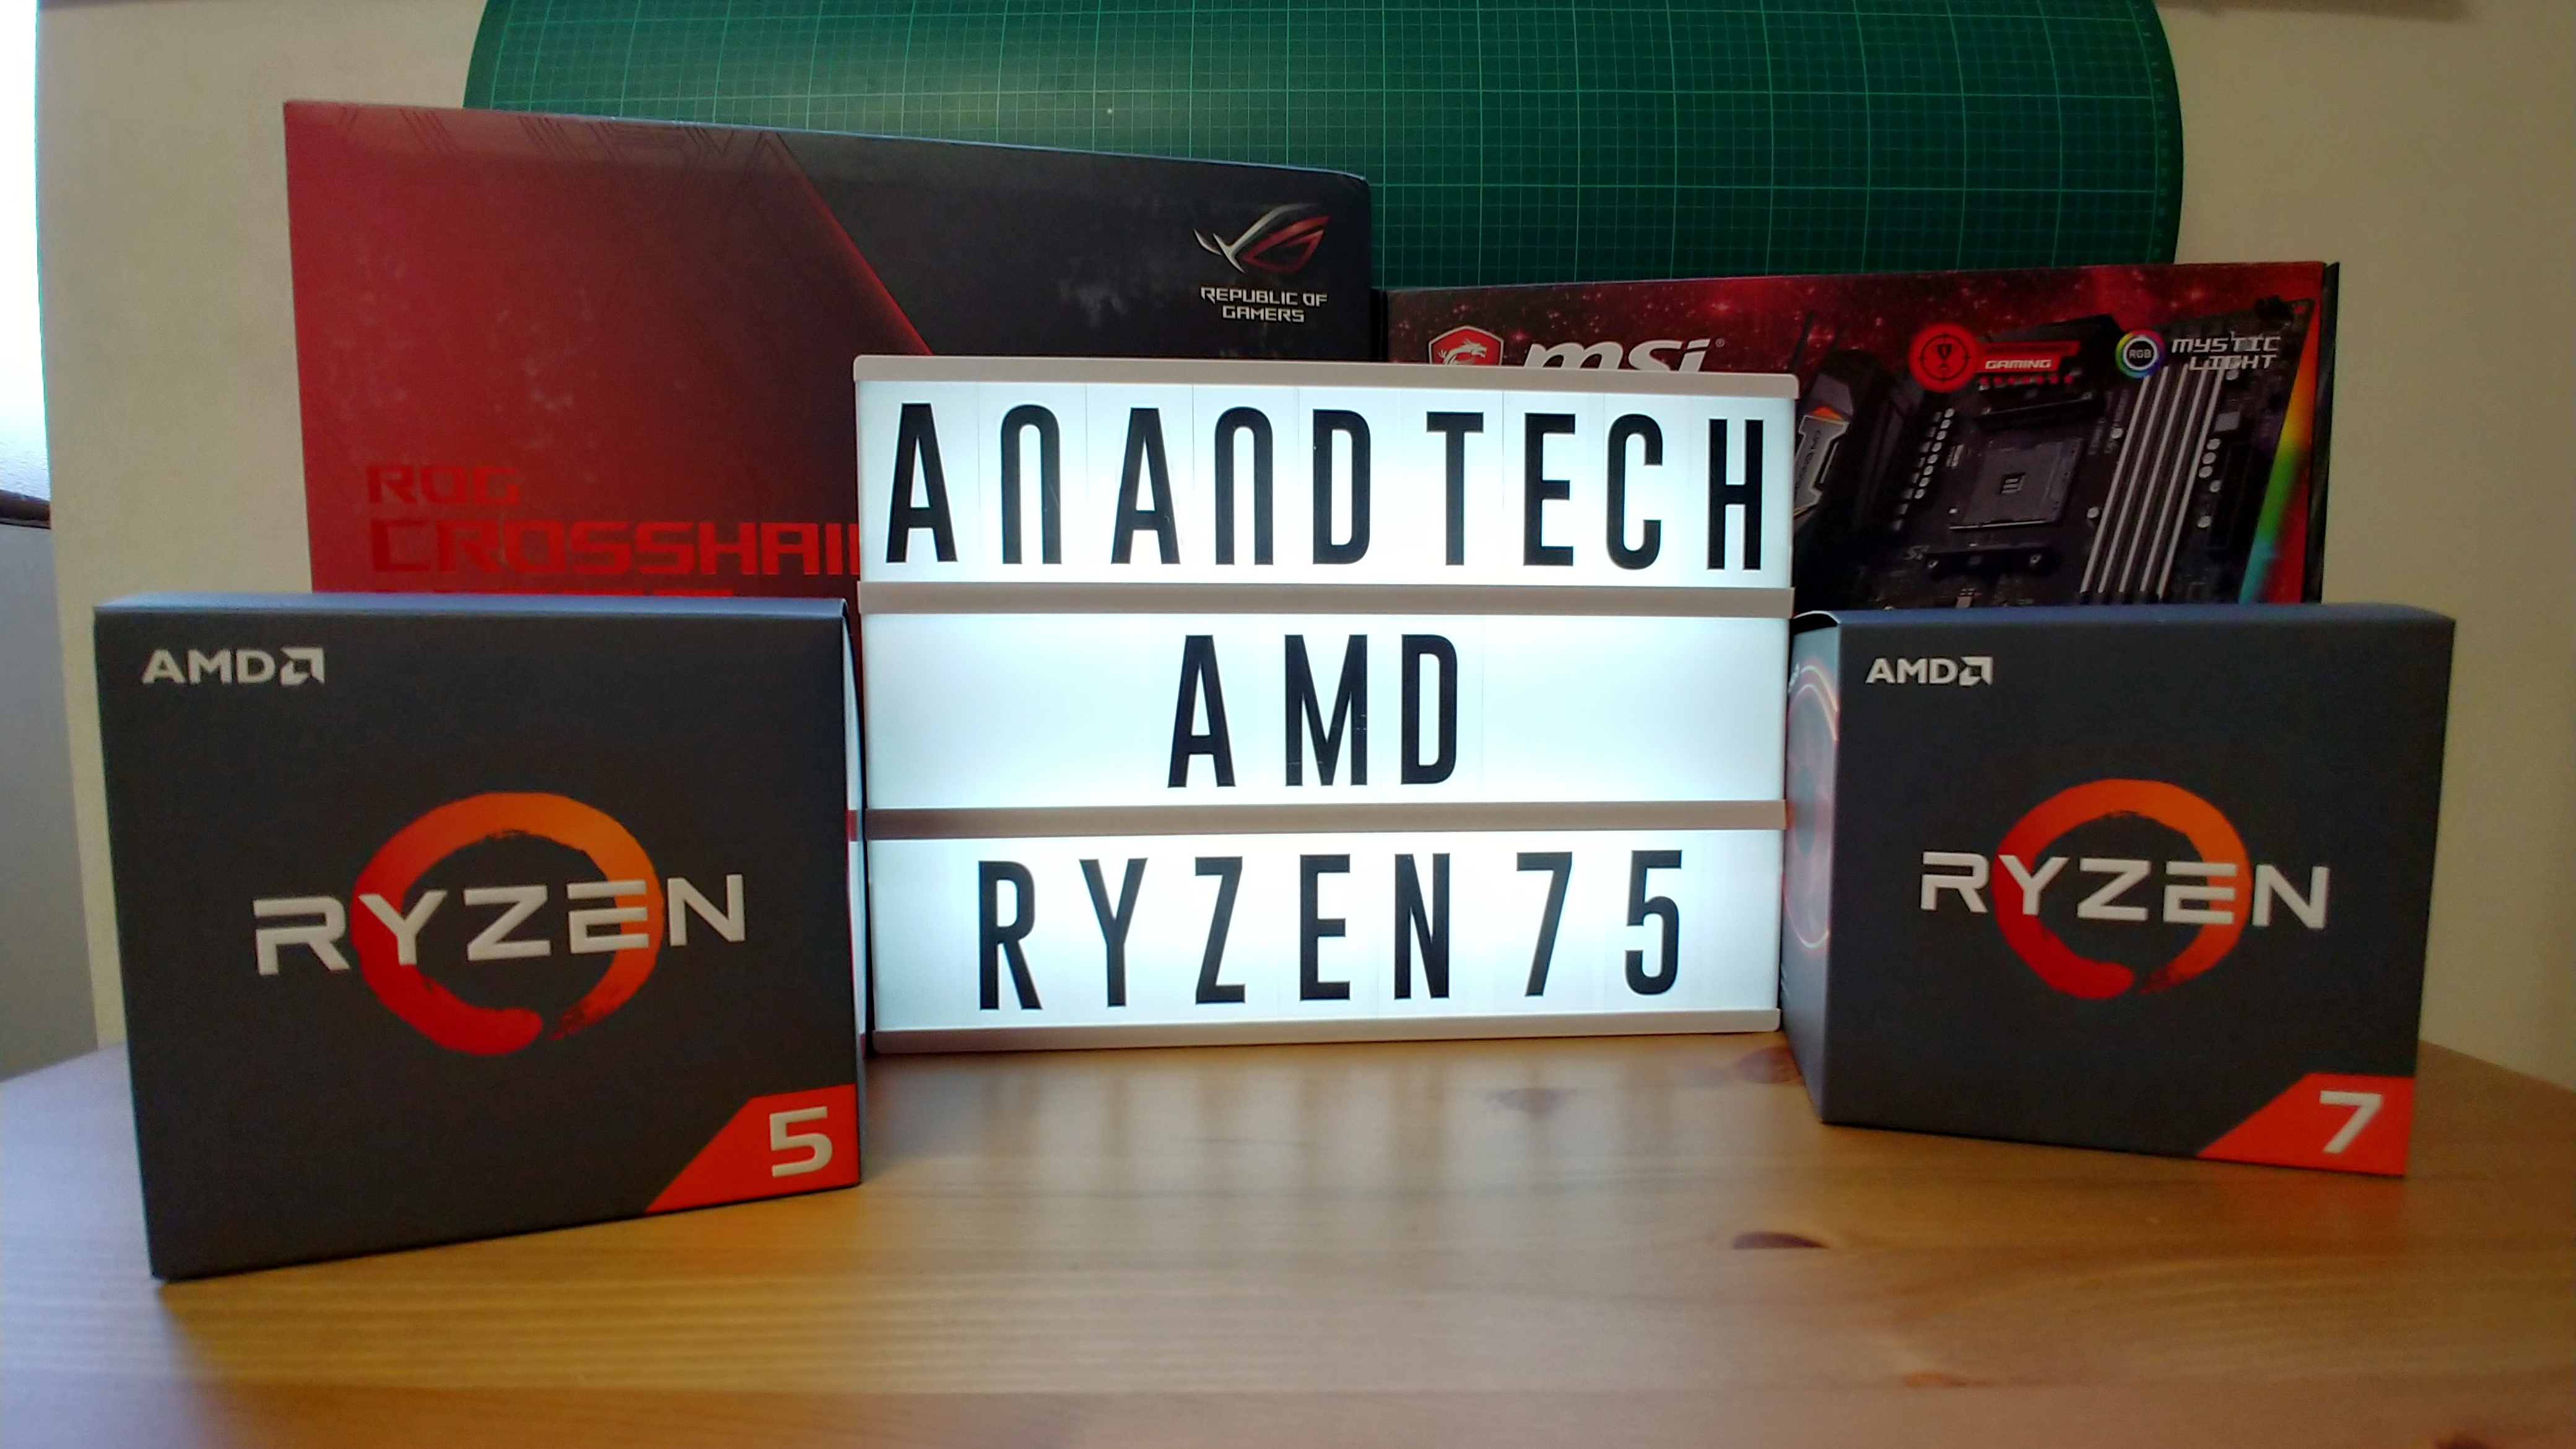
For readers that only want one piece of information, this is it: AMD is launching the Ryzen 7 2700X, the Ryzen 7 2700, the Ryzen 5 2600X, and the Ryzen 5 2600.
| AMD Ryzen 2000-Series CPUss | ||||
| Ryzen 7 2700X | Ryzen 7 2700 | Ryzen 5 2600X | Ryzen 5 2600 | |
| CPU Cores/Threads | 8 / 16 | 8 / 16 | 6 / 12 | 6 / 12 |
| Base CPU Frequency | 3.7 GHz | 3.2 GHz | 3.6 GHz | 3.4 GHz |
| Turbo CPU Frequency | 4.3 GHz | 4.1 GHz | 4.2 GHz | 3.9 GHz |
| TDP @ Base Frequency | 105 W | 65 W | 95 W | 65 W |
| L1 Cache | I: 64K. D: 32K | I: 64K. D: 32K | I: 64K. D: 32K | I: 64K. D: 32K |
| L2 Cache | 512 KB/core | 512 KB/core | 512 KB/core | 512 KB/core |
| L3 Cache | 16 MB | 16 MB | 16 MB | 16 MB |
| DRAM Support | DDR4-2933 Dual Channel |
DDR4-2933 Dual Channel |
DDR4-2933 Dual Channel |
DDR4-2933 Dual Channel |
| PCIe Lanes (CPU) | 16 Free + 4 NVMe | 16 Free + 4 NVMe | 16 Free + 4 NVMe | 16 Free + 4 NVMe |
| Price | $329 | $299 | $229 | $199 |
| Bundled Cooler | AMD Prism RGB | AMD Spire RGB | AMD Spire | AMD Stealth |
The Ryzen 7 2700X takes over the top spot from the Ryzen 7 1800X, and for an extra 10 W in TDP will provide a base frequency of 3.7 GHz and a turbo frequency of 4.3 GHz on its eight cores, with simultaneous multi-threading. This is an extra +100 MHz and +300 MHz respectively, going above the average limits of the 1800X when overclocked.
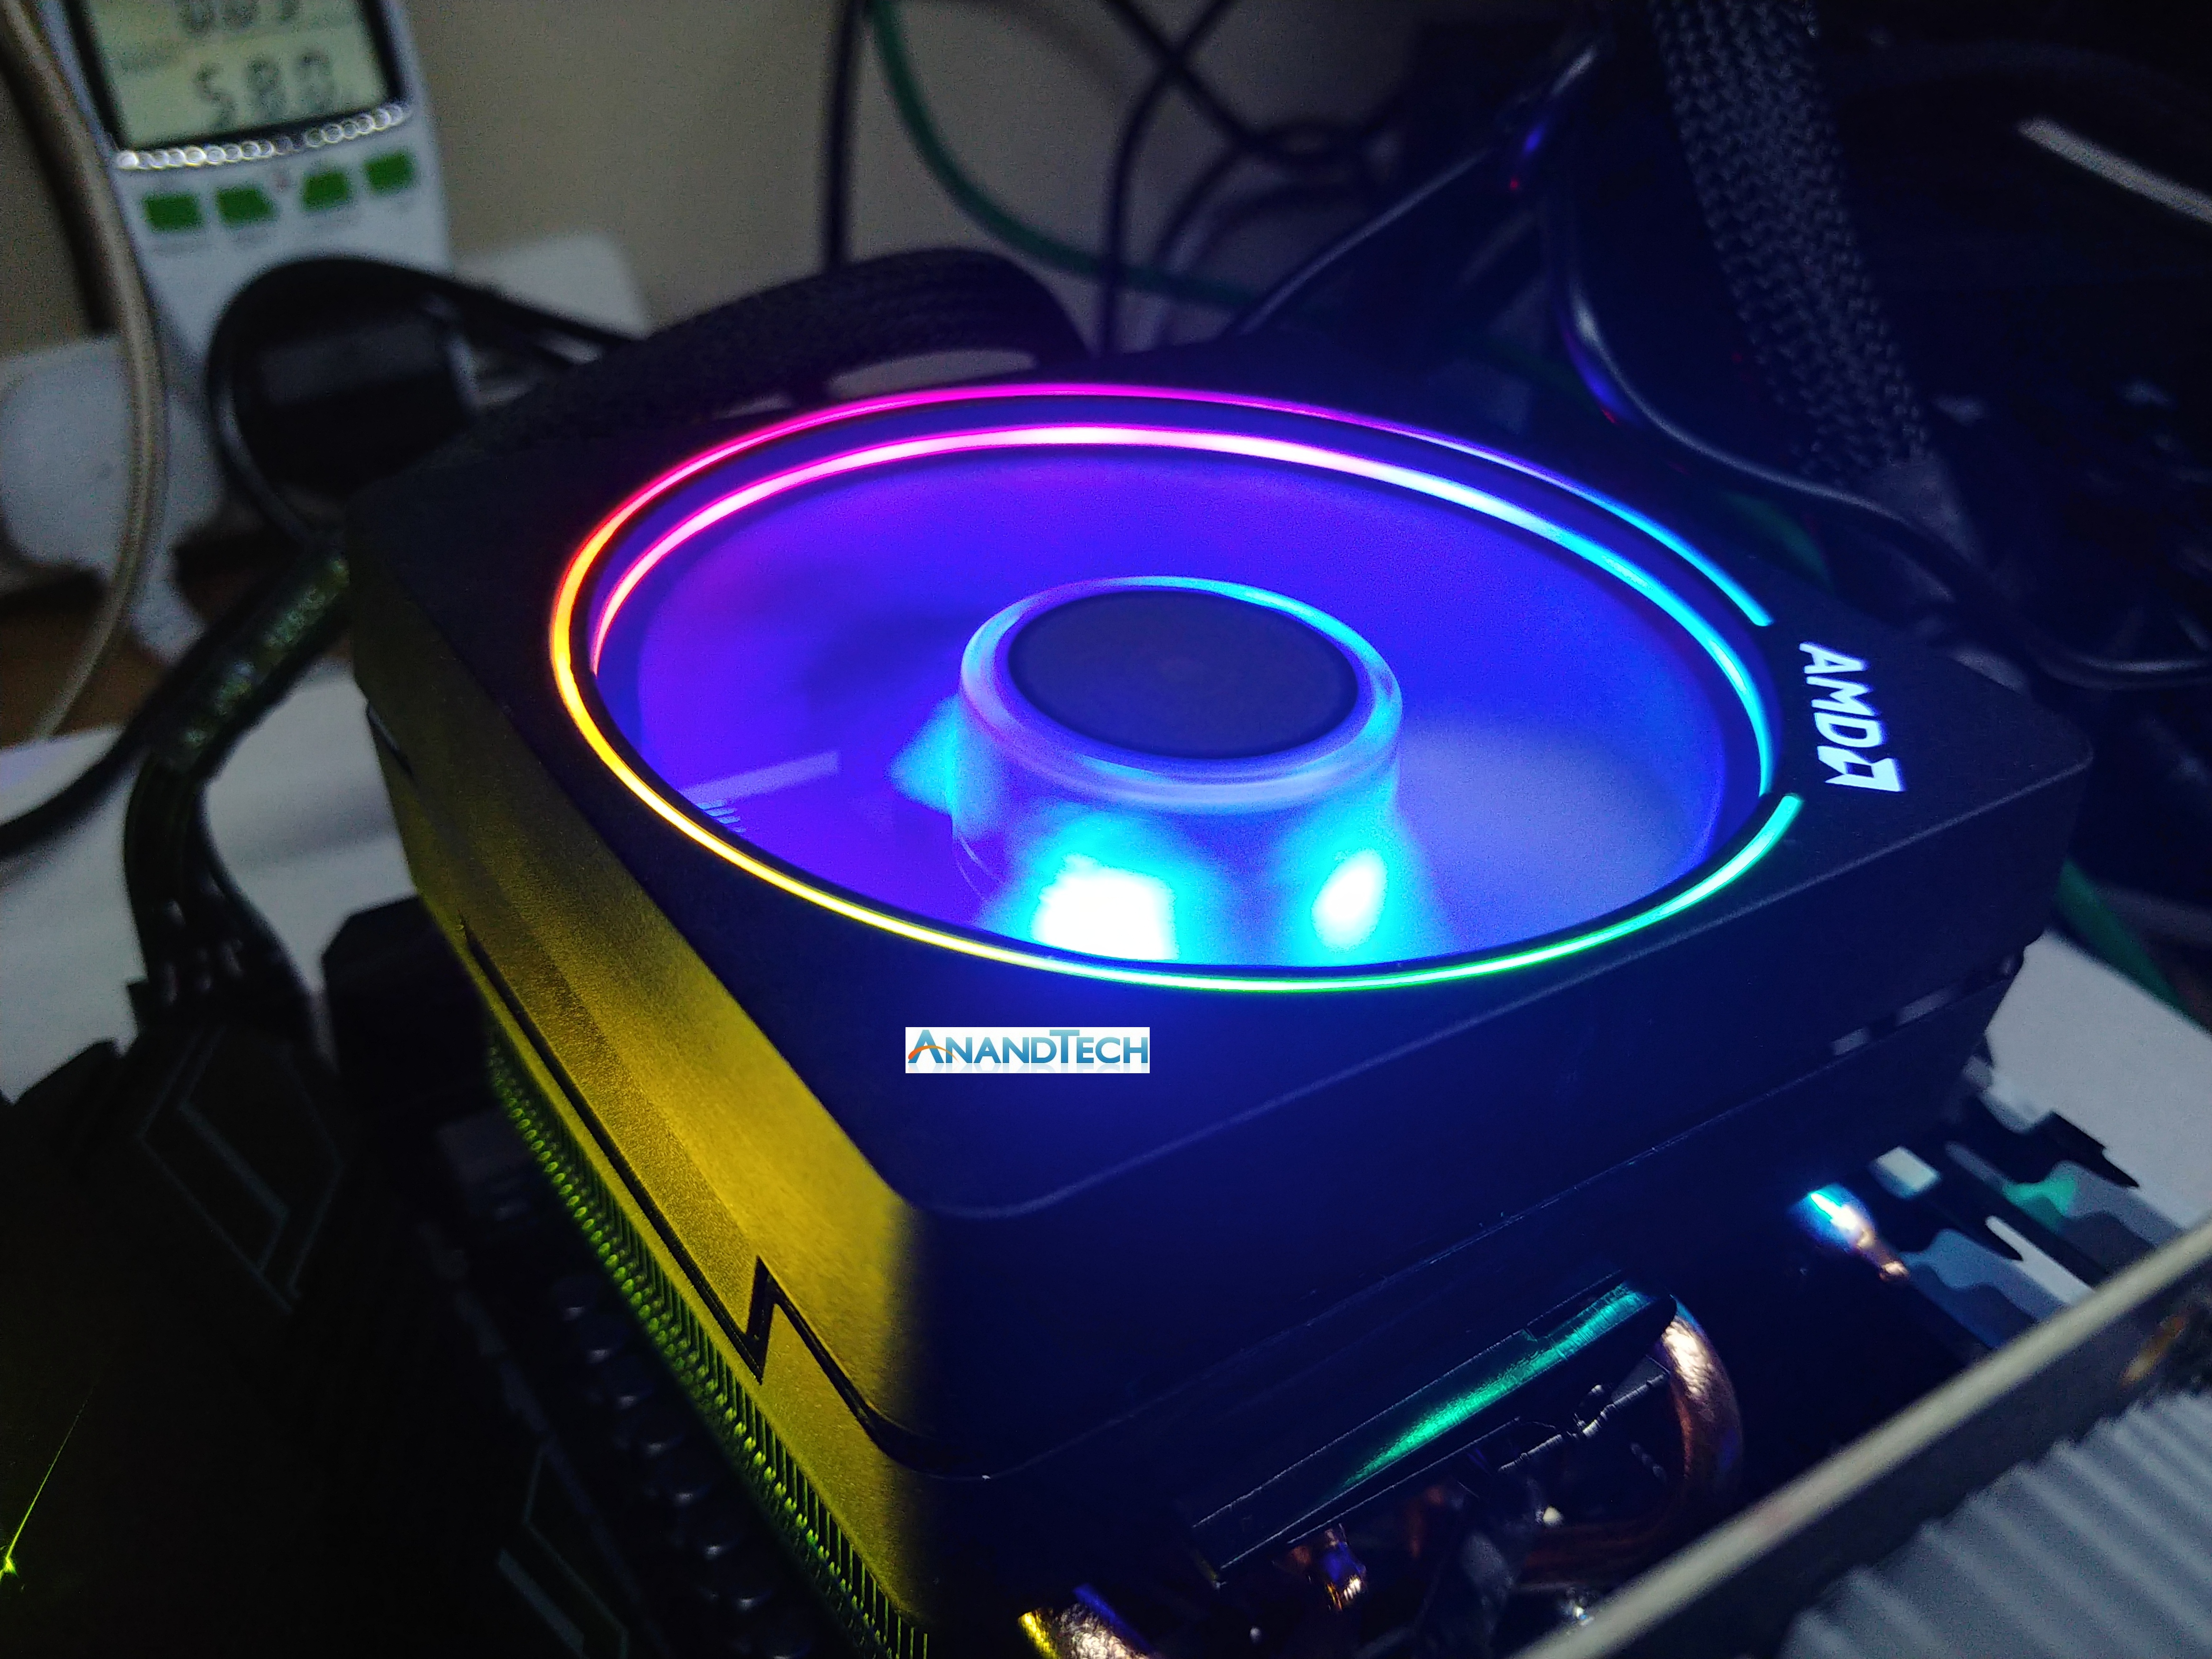
The 2700X also reduces the top cost for the best AM4 Ryzen processor: when launched, the 1800X was set at $499, without a bundled cooler, and was recently dropped to $349 as a price-competitor to Intel’s most powerful mainstream processor. The 2700X undercuts both, by being listed at a suggested e-tail price of $329, and is bundled with the best stock cooler in the business: AMD’s Wraith Prism RGB. AMD is attempting to hit all the targets: aggressive pricing, top performance, and best value, all in one go.
The Ryzen 5 2600X is the six-core option, also with an aggressive frequency strategy: 3.6 GHz base and 4.2 GHz turbo. At a 95W TDP and a suggested retail price of $229, it comes bundled with AMD’s Wraith Spire cooler, which again is an impressive stock cooler.
The Ryzen 7 2700 and Ryzen 5 2600 are the 65W versions of the X counterparts, offering near-similar frequencies for $30 less. All the CPUs will support dual-channel DDR4-2933 memory, up from the DDR4-2666 memory support of the 2017 Ryzen processors. One of the big changes is that now every processor comes with a bundled stock cooler, ranging from the Silent 65W Stealth models up to the big Prism RGB, all of which are easily sufficient for good turbo performance.
AMD’s intended AM4 Ryzen product line is now going to look like this:
| AMD Ryzen Product Stacks & Launch Prices | |||
| Ryzen 1000 (2017) | Ryzen 2000 (2018) | ||
| Ryzen 7 1800X | $499 | Ryzen 7 2700X | $329 |
| Ryzen 7 1700X | $399 | ||
| Ryzen 7 1700 | $329 | Ryzen 7 2700 | $299 |
| Ryzen 5 1600X | $249 | Ryzen 5 2600X | $229 |
| Ryzen 5 1600 | $219 | Ryzen 5 2600 | $199 |
| Ryzen 5 1500X | $189 | Ryzen 5 1500X | $159 |
| Ryzen 5 1400 | $169 | Ryzen 5 2400G | $169 |
| Ryzen 3 1300X | $129 | Ryzen 3 1300X | $114 |
| Ryzen 3 1200 | $109 | Ryzen 3 2200G | $99 |
At the top, the 2700X takes over from both the 1700X and 1800X. Rather than having three Ryzen 7 CPUs in the market for this generation, AMD examined its product line and opted on two, perhaps based on sales figures. As seen in this review, the 2700X is already pushing the silicon process to the limit, so there is not much headroom to go above this product for a new model in the future.
The full list ends up being a mix of Ryzen 2000-series CPUs (the new ones), Ryzen 2000-series APUs, and a pair of Ryzen 1000-series. We already examined the APUs in great detail in the past few weeks, showing that they directly replaced some of the original first-generation parts very easily. So far the four new 2000-series will sit at the top of the pile, however AMD’s strategy is often to drip feed its new parts, so we might see some more 2000-series as time goes on.
The Other Information From Today’s Launch
No launch is complete without talking about the features. AMD is using GlobalFoundries’ 12nm manufacturing process which has obvious on-paper benefits, however there are a number of internal firmware adjustments to touch upon, updated features and roles for AMD’s Precision Boost and XFR technologies that can have direct impacts on performance, a new chipset (along with 30+ motherboards) to run alongside the current offerings, and also new/renamed features such StoreMI. We also want to examine how these new products fit into AMD’s longer term plans and whether they are on track.
We’ll cover these in the next few pages, as well as the results from our testing.
- Talking 12nm: GlobalFoundries and Extra Performance
- Improvements to the Cache Hierarchy: +3% IPC and +10% Overall
- Precision Boost 2: Getting More Hertz Across The Board
- XFR2: A Dynamic Response to Cooling
- New X470 Chipset and Motherboards: A Focus on Power
- StoreMI: The Way To A Faster JBOD
- Power Analysis
- Our CPU Benchmarking Results
- Our Gaming CPU Benchmarking Results
- Conclusions
AMD’s Ryzen 2000 Competition: Intel’s Coffee Lake
As part of today’s launch, AMD went into extensive benchmarking detail about its new chips. It was abundantly clear from the data provided that these new processors are aimed squarely at Intel’s most recent mainstream processors: Coffee Lake. This is in contrast to when the Ryzen 1000-series was launched last year, when the octo-core Ryzen 7 1800X was compared against an 8-core Broadwell-E: in the interim Intel has updated its mainstream processor line to six-cores with high frequencies.
As a result, AMD is suggesting to compare the Ryzen 7 2700X against the Core i7-8700K and the Ryzen 5 2600X against the Core i5-8500K. This is significant – now both of the main x86 players in the processor market are keen to pit their most recent products against each other in a head to head battle. This hasn’t really happened like this for a number of generations. However, certain metrics will still run true as to the launch last year:
- Intel is expected to have a frequency and IPC advantage
- AMD’s counter is to come close on frequency and offer more cores at the same price
It is easy for AMD to wave the multi-threaded crown with its internal testing, however the single thread performance is still a little behind. A number of the new features with the Ryzen 2000-series are designed to help this: slightly higher IPC, higher frequencies, a higher TDP, and a better dynamic frequency boost model. We will cover these over the next few pages.
| Comparison: Ryzen 7 2700X vs Core i7-8700K | ||
| AMD Ryzen 7 2700X |
Features | Intel Core i7-8700K |
| 8 / 16 | Cores/Threads | 6 / 12 |
| 3.7 / 4.3 GHz | Base/Turbo | 3.7 / 4.7 |
| 16 (Free) + 4 (NVMe) | PCIe 3.0 Lanes | 16 (Free) |
| 512 KB/core | L2 Cache | 256 KB/core |
| 16 MB | L3 Cache | 12 MB |
| 105 W | TDP | 95 W |
| $329 | Price (List) | $349 |
Frequencies and core counts are one part of the equation, though the way that AMD and Intel have different cache models will also play a significant part. One of the things we will see in this analysis is the comparative cache metrics, as well as the tuning AMD has done to close the gap. For pricing, AMD has put the Ryzen 7 2700X below the i7-8700K, as well as bundling the Wraith Prism RGB stock cooler which easily replaces any $30-40 cooler, saving the user some money.
| Comparison: Ryzen 5 2600X vs Core i5-8600K | ||
| AMD Ryzen 5 2600X |
Features | Intel Core i5-8600K |
| 6 / 12 | Cores/Threads | 6 / 6 |
| 3.6 / 4.2 GHz | Base/Turbo | 3.6 / 4.3 |
| 16 (Free) + 4 (NVMe) | PCIe 3.0 Lanes | 16 (Free) |
| 512 KB/core | L2 Cache | 256 KB/core |
| 16 MB | L3 Cache | 9 MB |
| 95 W | TDP | 95 W |
| $229 | Price (List) | $239 |
The Ryzen 5 2600X comparison with the Core i5-8600K is much closer than the higher-end parts. These components share core counts, although the Ryzen 5 has double the threads. For any multithreaded workload that can take advantage of simultaneous multithreading is likely to pull ahead. The Core i5-8600K is slightly ahead in core frequency, and is expected to have an IPC advantage as well. Again, AMD bundles the CPU with a good stock cooler, whereas Intel’s offering is poor-to-nil.
Overall, AMD is claiming that its high-end processors will come in within 1-2% of the competition at 1440p gaming, but give +20% in ‘creative performance’. We’ve got a few ways to test this.


545 Comments
View All Comments
fallaha56 - Thursday, April 19, 2018 - link
Er look again Intel fanboisTechradar review with fully patched intel systems is showing exactly the same thing...
Spectre2 patch looks like it has a massive hit
Tropicocity - Thursday, April 19, 2018 - link
Then why do other reviews not show even near the level of performance gap between Ryzen 1 and Ryzen 2? It's not as if spectre or meltdown patches would somehow make the 2 series way better than the 1fallaha56 - Thursday, April 19, 2018 - link
XFR, ram, cooling, MCE, lots of variables hereBut the key difference is the patching and quite possibly the RAM
DearEmery - Thursday, April 19, 2018 - link
I tend to keep away from the comments here because I lack the knowledge to really contribute.I couldn't resist the urge to pop in because I'm certain this is the only time that sentence will be me boasting, when I'm reading comments from 'kill3x' and 'realistz' concerning 'hard fails'.
Follow my great example and realize your anecdote (leaving aside your 'hard fail' comprehending results and placing them in context the article hands you plenty of, assuming you read every word you should have), is right on the edge of worthless and garbage. Then read all the comments (particularly page one and two). Then come back tomorrow to get potential updates. Then go back into whatever game you were playing and be silly gooses there.
Ryan Smith - Thursday, April 19, 2018 - link
Hey Kill3x,To clarify, are you looking at the same sub-score we are, or the overall average? Our posted results are off of the first scene, Valley, as that's the most strenuous. The overall average is going to be higher, as you can see here: https://www.anandtech.com/bench/GPU16/1471
kill3x - Thursday, April 19, 2018 - link
Thank you for your reply, Ryan. Yes, this is more on point. But then again, if you mean Geothermal valley, I have different results there. The first area is Siberian wilderness with heavy snow, and I have lower results there. So a question arises about testing methods and testing scenes. Was it combat? Static? In a cave or on the top of area? All of these things affect FPS heavily. That's why the best way to review hardware in games is using scripted scenes and showing results in a video with detailed options' setup. Why didn't you guys just use ingame benchmark which 100% runs same scenes with same density? All of this looks like reviewer tried to cherrypick results in favor of Zen+. When you can't reproduce the result of a benchmark with same hardware as reviewer used is example of a bad approach and distortion of perception of your visitors.But then again, thank you, Ryan, for speaking with us and listening to our rant.
Ryan Smith - Thursday, April 19, 2018 - link
"Why didn't you guys just use ingame benchmark which 100% runs same scenes with same density?"To clarify, we do. We just use one of the scenes, and not the average of all of them. This is the same scene we've used for over a year now, since introducing this benchmark to our CPU & mobo testing suite.
kill3x - Friday, April 20, 2018 - link
Ryan, I retested Valley scene in built-in benchmark, this time with 8700k and gtx 980 Ti. I used high instead of very high, all options like on your screenshot. I got 122 FPS on valley with this settings. On 980 Ti. I'm really trying to keep this polite, but this is 20% difference on marginally weaker card. This just can't be a "gap" kind of error. These benchmarks are horribly wrong. Make your site and Ian a favor, Ryan, please consider retesting this. People are already suspect you of shill (rightfully so). Be an honest guy and just admit that a technical mistake was made, and correct it. Noone would blame you, mistakes happen. If you leave that as it is, it will be a much bigger mistake.divertedpanda - Saturday, April 21, 2018 - link
Your setup is no where near similar to theirs. You can't use your PC to Bench vs Them, and call it scientific.......kill3x - Saturday, April 21, 2018 - link
Yeah my setup's is nowhere near similar to theirs, and still my results are 20% better on 2 different CPUs. That kinda puts credibility of their review to zero, with all my respect to Ryan. The only goal was to put Ryzen 1 and CFL-S CPUs in a bad light, so people will buy new Ryzen 2 CPUs and suddenly find out that its capability's are not that huge.