The Qualcomm Snapdragon 835 Performance Preview
by Matt Humrick & Ryan Smith on March 22, 2017 4:30 AM EST- Posted in
- Smartphones
- Snapdragon
- Qualcomm
- Mobile
- SoCs
- Snapdragon 835
- Kryo
CPU and System Performance
Snapdragon 820 included Qualcomm’s first fully-custom 64-bit CPU cores. The unique microarchitecture’s floating-point IPC was very good, but integer IPC was no better than ARM’s older A57 core. Its power efficiency was lower than competing cores as well. Instead of using a revised quad-core Kryo arrangement for Snapdragon 835, Qualcomm decided to go in a completely different direction.
The new Kryo 280, despite the similar name, shares no design DNA with the original Kryo. Its an octa-core, big.LITTLE configuration with four “performance” cores and four lower-power “efficiency” cores. What makes Kryo 280 unique, however, is that it’s the first design to use ARM’s new "Built on ARM Cortex Technology" (BoC) license, which allows vendors to customize ARM cores. This new semi-custom option gives vendors the ability to differentiate their products from those using ARM’s stock cores while avoiding the more costly route of creating a fully-custom design from scratch.
The BoC license allows the vendor to request certain modifications, particularly to the fetch block and issue queues, but certain parts of the microarchitecture are off limits, including the decoder and execution pipelines, because modifying these blocks requires too much effort. Qualcomm is not disclosing which ARM cores serve as the foundation for Kryo 280 or precisely which modifications it requested, but it did say that both CPU clusters use semi-custom cores. Qualcomm also confirmed that Snapdragon 835’s memory controllers are its own design.
| Geekbench 4 - Integer Performance Single Threaded |
|||
| Snapdragon 835 | Snapdragon 821 (% Advantage) |
Snapdragon 810 (% Advantage) |
|
| AES | 905.40 MB/s | 559.10 MB/s (61.9%) |
714.47 MB/s (26.7%) |
| LZMA | 3.13 MB/s | 2.20 MB/s (42.3%) |
1.92 MB/s (63.0%) |
| JPEG | 16.80 Mpixels/s | 21.60 Mpixels/s (-22.2%) |
12.27 Mpixels/s (36.9%) |
| Canny | 23.60 Mpixels/s | 30.27 Mpixels/s (-22.0%) |
23.63 Mpixels/s (-0.1%) |
| Lua | 1.84 MB/s | 1.47 MB/s (25.2%) |
1.20 MB/s (53.3%) |
| Dijkstra | 1.73 MTE/s | 1.39 MTE/s (24.5%) |
0.91 MTE/s (90.1%) |
| SQLite | 53.00 Krows/s | 36.67 Krows/s (44.5%) |
33.30 Krows/s (59.2%) |
| HTML5 Parse | 8.67 MB/s | 7.61 MB/s (13.9%) |
6.38 MB/s (35.9%) |
| HTML5 DOM | 2.26 Melems/s | 0.37 Melems/s (510.8%) |
1.26 Melems/s (79.4%) |
| Histogram Equalization | 52.90 Mpixels/s | 51.17 Mpixels/s (3.4%) |
53.60 Mpixels/s (-1.3%) |
| PDF Rendering | 50.90 Mpixels/s | 52.97 Mpixels/s (-3.9%) |
43.70 Mpixels/s (16.5%) |
| LLVM | 196.80 functions/s | 113.53 functions/s (73.3%) |
108.87 functions/s (80.8%) |
| Camera | 5.71 images/s | 7.19 images/s (-20.6%) |
4.69 images/s (21.7%) |
The Snapdragon 835’s Kryo 280 CPU shows a noticeable improvement in integer IPC relative to the 820/821’s Kryo core. This is not unexpected, however, considering integer performance was not one of Kryo’s strengths. While most workloads see large increases, there are a few regressions too, notably in JPEG, Canny, and Camera. We saw this same performance pattern from Kirin 960’s A73 CPU as well. These integer results, along with L1/L2 cache behavior, match the A73’s unique performance fingerprint, confirming that Kryo 280’s performance cores are based on ARM’s latest IP.
Quickly comparing Snapdragon 835 and Kirin 960 Geekbench 4 Integer results also shows performance variations that cannot be fully explained by differences in frequency or normal testing variance. The differences only occur in a few specific tests and range from 9% to -5%, which again is not completely unexpected given the limited number of modifications the BoC license allows for semi-custom designs.
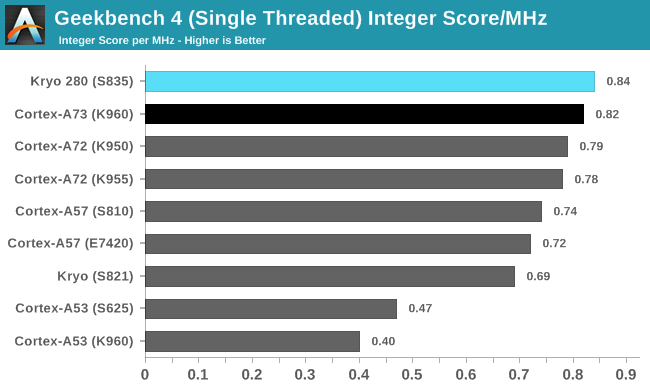
The chart above divides the overall integer score by CPU frequency, making it easier to directly compare IPC. Taken as a whole, the performance of Kryo 280’s semi-custom performance core is not much different than the Kirin 960’s A73 core in this group of workloads, with individual gains and losses nearly averaging out. Its overall IPC is also only about 6% higher than A72 and 14% higher than A57. Its advantage over Snapdragon 820/821 widens to 22%, partly because Kryo’s poor performance in the LLVM and HTML5 DOM workloads drags down its overall score.
While Snapdragon 835 leads other SoCs by a slim margin in this test, it’s not a sweeping victory. Just like we saw with Kirin 960’s A73 cores, performance improves in some workloads but regresses in others.
| Geekbench 4 - Floating Point Performance Single Threaded |
|||
| Snapdragon 835 | Snapdragon 821 (% Advantage) |
Snapdragon 810 (% Advantage) |
|
| SGEMM | 11.5 GFLOPS | 12.2 GFLOPS (-5.7%) |
11.0 GFLOPS (4.2%) |
| SFFT | 2.9 GFLOPS | 3.2 GFLOPS (-9.7%) |
2.3 GFLOPS (25.2%) |
| N-Body Physics | 879.6 Kpairs/s | 1156.7 Kpairs/s (-24.0%) |
580.2 Kpairs/s (51.6%) |
| Rigid Body Physics | 6181.7 FPS | 7171.3 FPS (-13.8%) |
4183.4 FPS (47.8%) |
| Ray Tracing | 232.6 Kpixels/s | 298.7 Kpixels/s (-22.0%) |
130.1 Kpixels/s (78.7%) |
| HDR | 7.8 Mpixels/s | 10.8 Mpixels/s (-27.6%) |
6.4 Mpixels/s (21.9%) |
| Gaussian Blur | 23.4 Mpixels/s | 48.5 Mpixels/s (-51.8%) |
21.9 Mpixels/s (6.7%) |
| Speech Recognition | 13.9 Words/s | 10.9 Words/s (27.5%) |
8.1 Words/s (71.4%) |
| Face Detection | 513.8 Ksubs/s | 685.0 Ksubs/s (-25.0%) |
404.4 Ksubs/s (27.0%) |
Snapdragon 835’s Kryo 280 takes two steps backwards when running Geekbench 4’s floating-point workloads, finishing well behind Snapdragon 820/821’s Kryo core and even a little behind SoCs using the A72 core. Its IPC is on par with the Kirin 960’s A73 core, with even less variation between individual scores than we saw when running the integer workloads.
The A73’s slight performance regression relative to the A72, which also applies to the semi-custom Kryo 280, is a bit surprising, because their NEON execution units are relatively unchanged from the A72’s design. If anything, the A73’s lower-latency front end and improvements to its fetch block and memory system should give it an advantage, but that’s not the case. The A73’s narrower decode stage could limit performance for some workloads but not all. Both the Kirin 960’s A73 and Snapdragon 835’s Kryo 280 show reduced L2 cache read/write bandwidth (and lower L1 write bandwidth) relative to A72, which could also negatively impact performance.
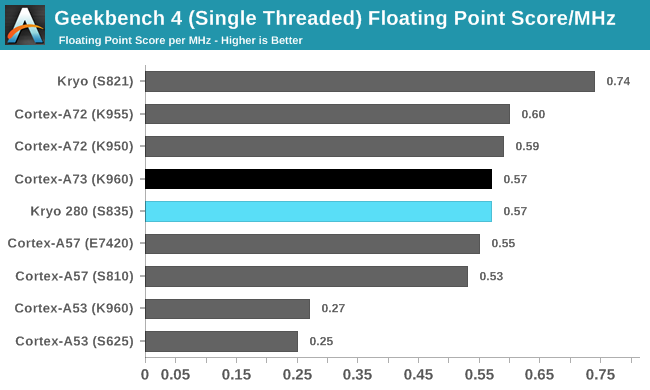
Snapdragon 835’s floating-point IPC is 23% lower than Snapdragon 820/821’s. One has to wonder if this is the result of a forced compromise or a willing change in design philosophy. When Qualcomm started work on Kryo more than 2 years ago, it may have envisioned new workloads that never materialized. Or it could be that with more compute workloads shifting to the GPU and DSP to improve efficiency, it was willing to sacrifice some floating-point performance to save area and power.
| Geekbench 4 - Memory Performance Single Threaded |
|||
| Snapdragon 835 | Snapdragon 821 (% Advantage) |
Snapdragon 810 (% Advantage) |
|
| Memory Copy | 4.70 GB/s | 7.82 GB/s (-39.9%) |
3.99 GB/s (17.8%) |
| Memory Latency | 13.95 Mops/s | 6.64 Mops/s (110.1%) |
4.29 Mops/s (225.2%) |
| Memory Bandwidth | 17.95 GB/s | 13.53 GB/s (32.7%) |
7.15 GB/s (151.0%) |
The Kryo 280, A73, A72, and A57 cores all have 2 address generation units (AGUs). Unlike the A72/A57, however, which use dedicated AGUs for load and store operations, each AGU in Kryo 280/A73 is capable of performing both operations. For Kirin 960, this change, among others, reduces memory latency and significantly improves bandwidth to main system memory relative to Kirin 950.
Snapdragon 835’s memory latency and bandwidth numbers are even better than Kirin 960’s—up to 11% after accounting for differences in CPU frequency. The 835 sees impressive gains over the 820/821 too. Switching to Kryo 280 does not provide the same bandwidth boost as the switch to A73 did for Kirin 960, however, because Kryo’s 2 AGUs were already capable of performing both load and store operations, albeit with a higher latency in some cases.
System Performance
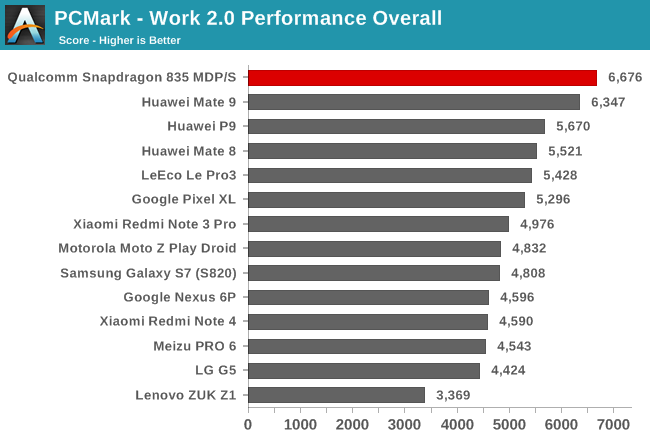
So far our initial results show Snapdragon 835’s Kryo 280 is a big.LITTLE combination of semi-custom A53 and A73 CPU cores, whose integer and floating-point IPC is similar to Kirin 960. System-level tests like PCMark, which includes several realistic workloads that stress the CPU, GPU, RAM, and NAND storage using standard Android API calls, are affected by more than just CPU IPC and memory latency, however. Device OEMs tune the software parameters that control the scheduler and DVFS systems to achieve the desired balance between performance and battery life, to meet quality of service goals, and to stay within a particular design's thermal limits.
No doubt we'll see performance vary among the upcoming Snapdragon 835 devices, just like we do with other SoCs, but for now we see Qualcomm’s 835 MDP/S with the top overall score in PCMark, just barely ahead of the Mate 9 and its Kirin 960 SoC. It’s also 23% faster overall than the top-performing Snapdragon 821 phone.
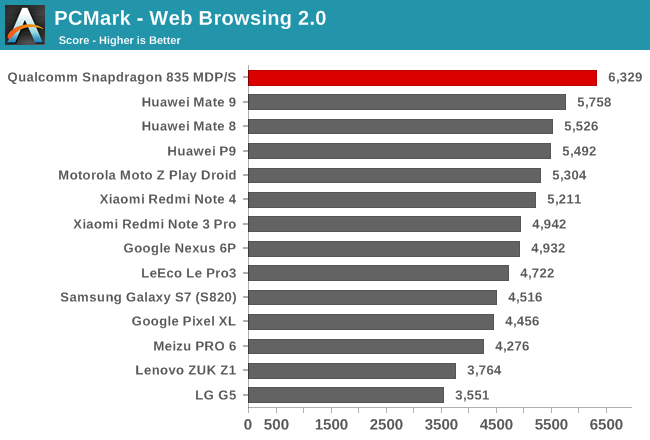
The Snapdragon 835 MDP/S performs well in the Web test, although its advantage over the Mate 9 is only 10%. Its performance lead over the Snapdragon 820/821 phones, which all fall behind SoCs using ARM’s A72 and A73 CPUs, grows to 34% in this integer-heavy test.
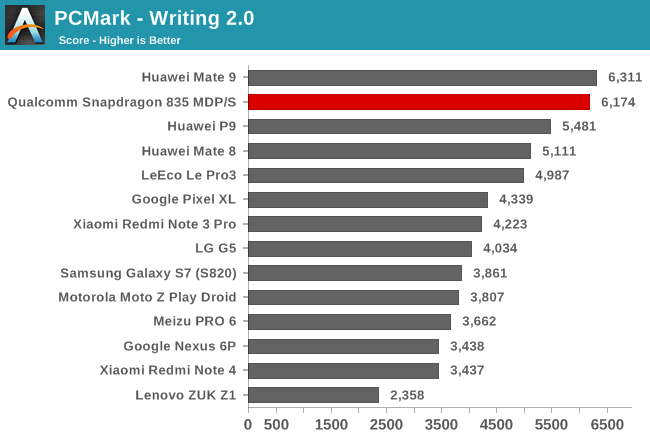
The PCMark Writing test generates frequent, short bursts of activity on the big CPU cores while performing a variety of operations, including PDF processing and file encryption (both integer workloads), memory operations, and even reading and writing some files to internal NAND. Because of this, it tends to produce the most varied results. Take the spread between the Snapdragon 820/821 phones, for example, where the LeEco Le Pro3 is 40% faster than the Galaxy S7 edge. The performance difference between the Snapdragon 835 MDP/S and Mate 9 is negligible, however. Comparing Snapdragon 835 to older members of the Snapdragon family reveals more significant differences; it’s 24% faster than the LeEco Le Pro3 (S821), 80% faster than the Nexus 6P (S810), and 162% faster than the Lenovo ZUK Z1 (S801AC).
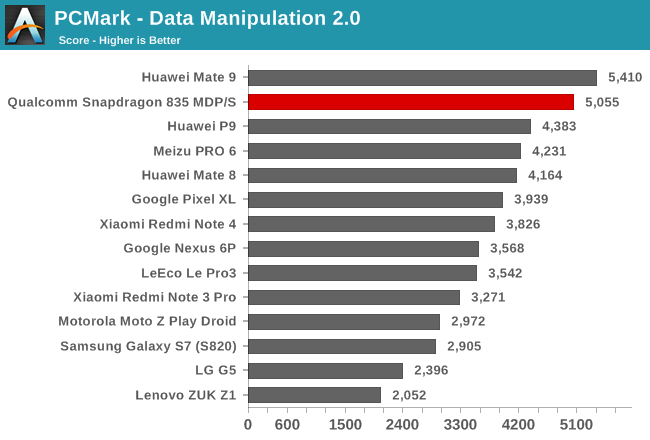
The PCMark Data Manipulation test is another primarily integer workload that measures how long it takes to parse chunks of data from several different file types and then records the frame rate while interacting with dynamic charts. Once again the Snapdragon 835 MDP/S and Mate 9 deliver similar performance, but they separate themselves a little further from the pack. Like we saw in the Writing test, the phones using Snapdragon 820 show significant performance variation, providing another example of how OEM tinkering impacts the user experience. The Snapdragon 835 MDP/S outperforms the Pixel XL by 28% and the LG G5 by 111%.
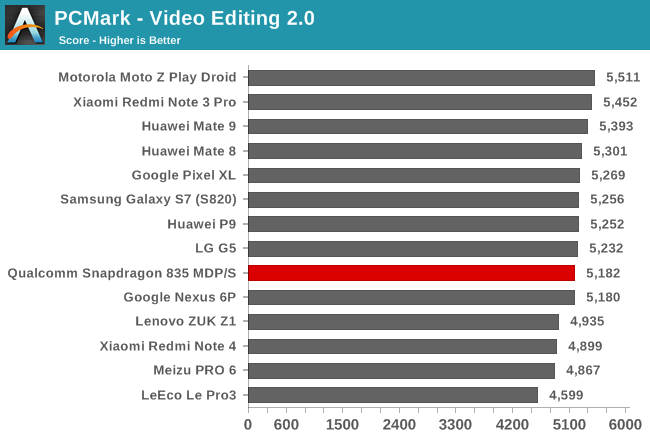
The Video Editing test, which uses OpenGL ES 2.0 fragment shaders for applying video effects, actually presents a very light load to the system. After monitoring the behavior of several phones while running this test, I’ve noticed that GPU frequency remains close to idle and most phones do not migrate threads to the big CPU cluster, using the little A53 cluster exclusively, which is why we see very little performance variation in this test.
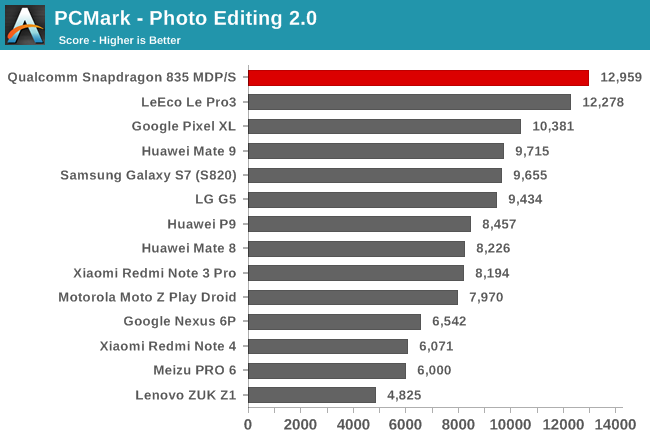
The Photo Editing test applies a number of different photo effects and filters with both the CPU and GPU. The Snapdragon 835 MDP/S and the phones using Snapdragon 820/821 rise to the top of the chart thanks to their Adreno GPU’s strong ALU performance. The 835’s Adreno 540 GPU helps it perform 33% better than the highest performing phone with an ARM GPU, the Mate 9 and its Mali-G71.
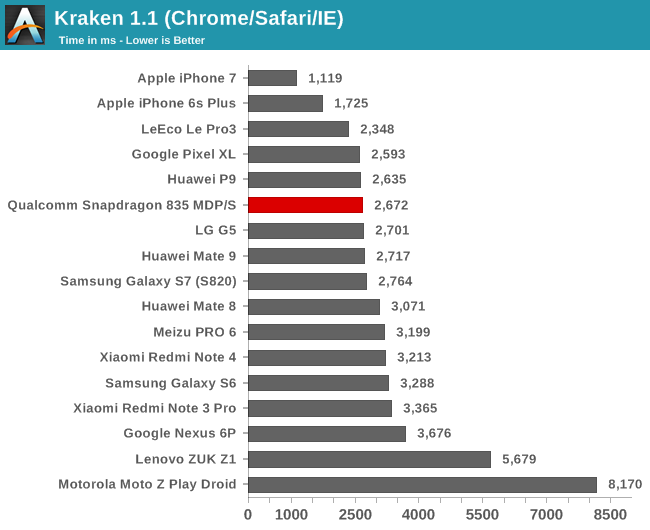
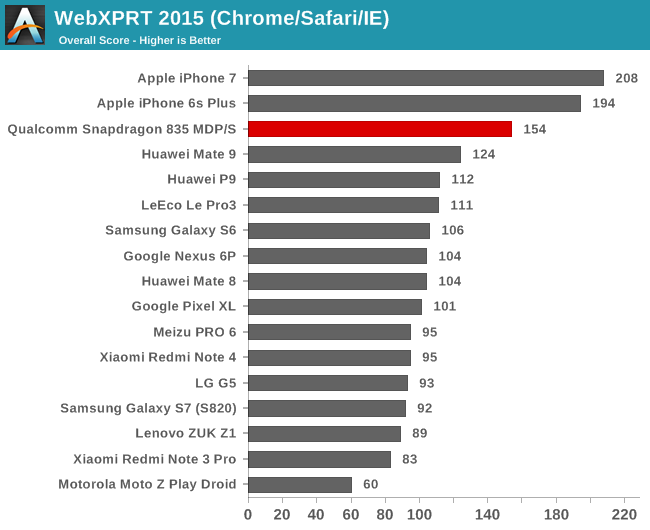
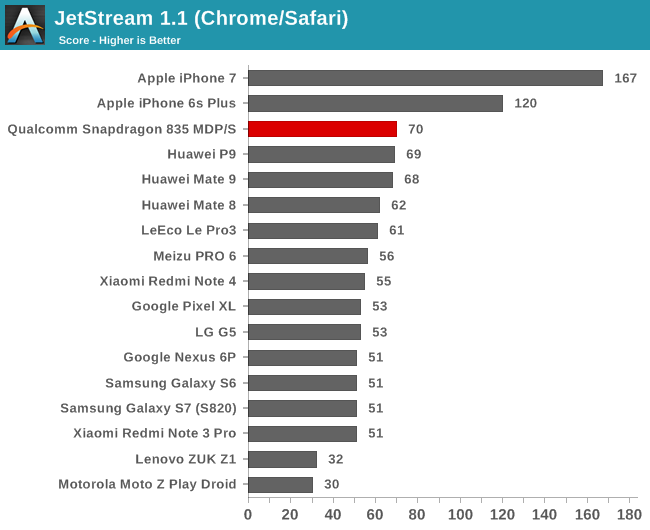
Yes, the iPhones perform well in these JavaScript tests. No, you cannot use these tests to compare IPC between Apple’s A-series SoCs and those found in Android phones, because they are running different browsers. A significant portion of the iPhones’ performance advantage actually comes from Safari’s JavaScript engine.
The Snapdragon 835 MDP/S compares favorably to other phones using the Chrome browser (all of the phones are using the latest version). It joins the Snapdragon 820/821 phones at the top of the chart in Kraken, although, its performance is no different. It essentially matches the Mate 9 in JetStream too, but pulls ahead of the Snapdragon 820/821 phones by 15% to 37%. Performance is unexpectedly good in WebXPRT 2015 where it pulls ahead of the Mate 9 by 24% and up to 67% over the Galaxy S7 (S820).
As an additional point of interest, and to further highlight the software layer’s effects, we also ran these tests using Qualcomm’s internally developed browser that’s optimized for Snapdragon SoCs. Kraken only sees a modest improvement to 2,305 ms, but JetStream improves by 24% to 87 and WebXPRT 2015 jumps to 280, an 82% improvement.


128 Comments
View All Comments
gigathlete - Wednesday, March 22, 2017 - link
There is individual load times per app at the end of the video did you finish the whole thing?techconc - Monday, April 3, 2017 - link
@TadzioPazurThe "test" isn't broken. Rather, it's a measure of NAND storage performance rather than of the SoC.
grayson_carr - Saturday, March 25, 2017 - link
Kind of an unfair test. On Android, they completely disabled animations, so apps appear as soon as they are loaded, but on iOS there is no option for that. They claim they disabled animations on iOS, but they actually just enabled the reduce motion feature, which doesn't disable animations, but just changes them from a zoom to a fade animation.TadzioPazur - Wednesday, March 22, 2017 - link
No. You seem to miss the point, as apperent from your post, comparing a SoC (835) to a complete product (6 month old phone). This is an important distinction, as pointed out by the editors: commanding victories in JS department come largely (if not solely) from the JS engine used by the browser.Let's nitpick the iPhone7s standings:
CPU tests: 8 x N/A, 3 x 1st (all JavaScript)
GPU tests: joint 1st, 2nd, N/A, N/A, 6, 2, 12, 1, N/A N/A, joint 1st
So iPhone is present on 10 graphs, being non-joint 1st ("trouncing everything else") on 4 of them. Hardly "most of graphs".
lefty2 - Wednesday, March 22, 2017 - link
iPhone 7 scores 3306 in geekbench 4 single core, while the fastest android Samsung Galaxy S7 scores 1789 (https://browser.primatelabs.com/ios-benchmarks). So, yankeeDDL is correct, Apple's A10 trounces everything else (in single thread, which is the most important in a smartphone).joms_us - Wednesday, March 22, 2017 - link
Except that Geekbench is worthless and does not represent real-world performance.melgross - Wednesday, March 22, 2017 - link
No worse than any of the other tests such as PCMark. The importance is that all of these devices will perform about the same in real world use as they do in these tests.milli - Wednesday, March 22, 2017 - link
Geekbench is synthetic. PCMark tests with actual apps.joms_us - Thursday, March 23, 2017 - link
Yep, PCMark is the best out there. It is doing real tasks, you can see what it is doing not just some random progress bar or percent like Geekbench LoL.arayoflight - Wednesday, March 22, 2017 - link
Geekbench scores shouldn't be compared across platforms since language used as well as the compiler can make a lot of difference.My old lenovo y510p scored 3600 single core on geekbench single core in Windows. When I booted in Ubuntu, the score jumped to 4400. Multi core scores were 11000 and 12500 respectively.
As evident, it's pretty pointless to compare it. Not to mention that almost all the tests can be done in L2 cache if it's sufficiently big. That's a really unrealistic test.